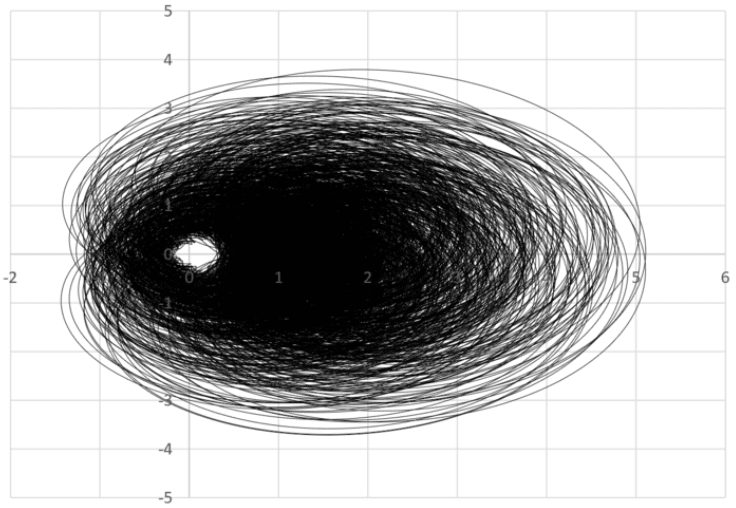
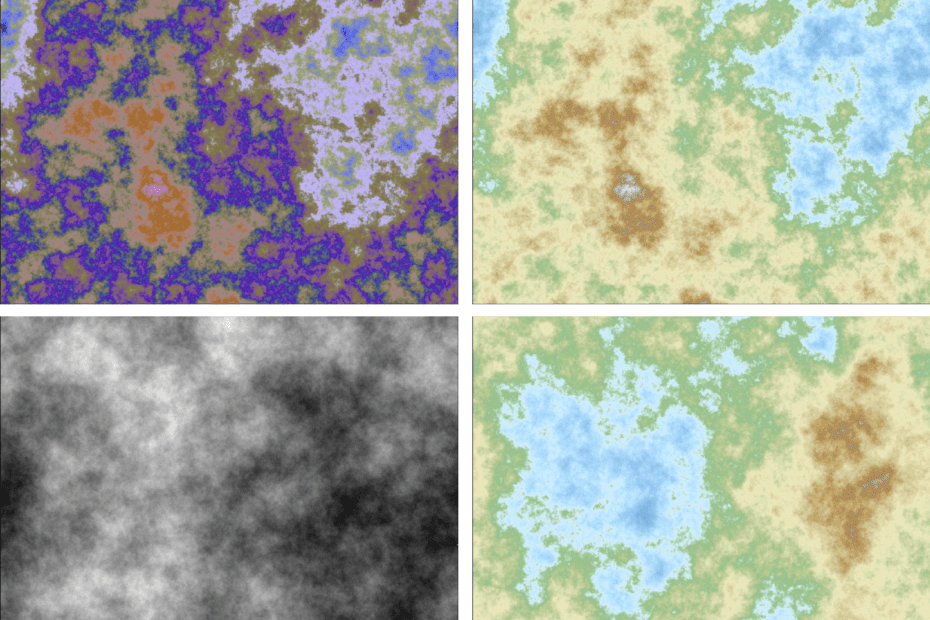
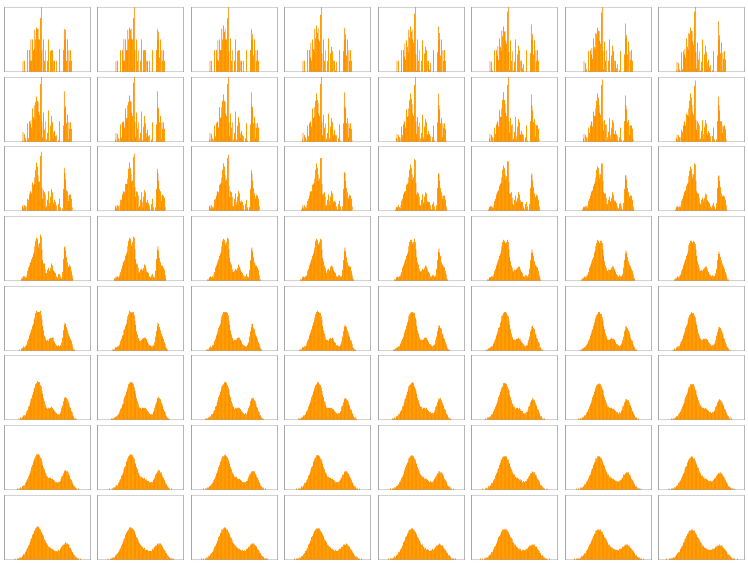
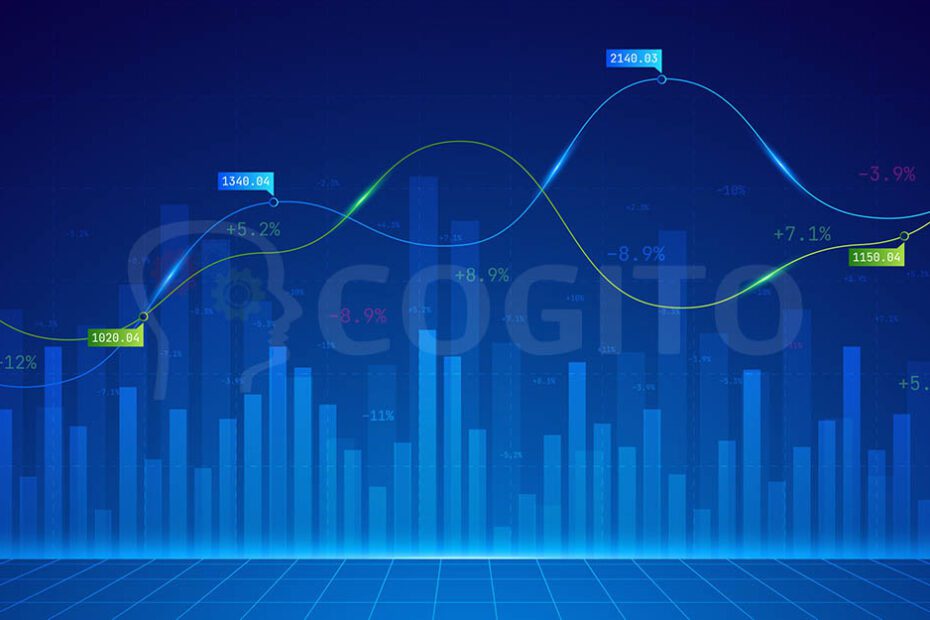
Home » Technical Topics » AI Visualization

AI Visualization

Visualizations play an increasingly prominent role in the realm of AI. Past a certain point, information simply cannot be conceptualized by staring at words or numbers, you need a picture. Articles in this category focus on visualization at all levels, from analytics to 3D rendering, dashboards to user experience, deep fakes to media blockbusters.

3d render of concept data visualization, collection, processing,

Introduction to Data Visualization in Python

  • Ankit Dixit 

Having tabular data can make it challenging to comprehend your data when working with it genuinely. Visualizing data or representing it in a pictorial form will enable us to understand better what the information means and how to clean and use it. Tables and CSV files can’t reveal patterns, correlations, or trends, but graphs can.

Businessman works with financial data

How Data Visualization is Essential for the Banking and Finance Sector

Representation of data using graphics such as charts, plots, infographics, heat maps, bubble clouds, scatter plots, mekko charts, animation, etc., is termed data visualization. Such visual displays and representation of information help communicate complex data relationships and data-driven insights in a way that makes it easy to understand and base decisions on.

download-12

Art and AI: The Line Blurs Further

  • ajitjaokar 

Let’s look at this story in more detail because in my view, it shows something much more fundamental which is often overlooked. In my view, the future of all jobs will be in collaborating with AI !

teacher-businesswoman-writing-mind-mapping-complex-diagram-resized

Imaging the Web With Scalable Vector Graphics

  • Kurt Cagle 

SVG is an example of one of the more powerful technologies on the web that is likely completely invisible to you, whether you’re simply browsing on the web or you’re a web developer wanting to take advantage of your full toolset.

Browse By Topic