
Written by Venkata Nori and Kshitij Gopali.
Introduction
As technology is evolving, most companies in the world are adopting advanced mechanisms for their daily tasks of storing/updating data, project management & tracking, incident management, version control, etc. Periodically, these companies’ business stakeholders would want to extract and analyze the data to see how the business is performing and improvement areas. Some of the frequently used agile and cloud systems are Jira, ServiceNow, Git, and Cloud data storage technologies like Box, Snowflake, Cloud Object Storage, Amazon S3, etc. Ironically, I still find many stakeholders of these organizations who hold responsible positions in each of the departments in an organization, following the conventional way of processing tasks of manually exporting data into large excel sheets, layering data, applying complicated and lengthy excel formulae, pivoting, ending up with days amount of work and laborious tasks of maintaining, analyzing their data. The conventional solutions also come with the price of being extremely slow in background processing which makes it further difficult to analyze data. Apparently, the technological advancements that the organizations have adapted are still not catering to age-old employees. This article focuses on how new-age phenomena like data science and analytics can bridge this gap and seamlessly integrate & process data from multiple unconventional source systems in a format suitable for data analytics.
Leveraging Data Science with Analytics
As a senior data scientist, my job is to understand the source ecosystems of my organization – what kind of data exists, and KPIs that are part of metrics measurement and analysis. So as part of the research, I unleased the capabilities of data science technologies like Python which has a myriad of modules and libraries that it can use to connect to these source systems. Before delving deeper, I would like to summarize the prerequisites that I gathered for an end-to-end implementation of an analytics solution.
Domain: HR
Business Goal: Improving the hiring efficiency, Trend analysis of headcount data across time/region/department, Retention management, effective utilization of annual hiring budget, talent development, and increasing productivity of employees and managers.
Data type: Hiring & Head Count, Incident Management, Project Management, Issue tracking.
KPIs: Headcount, # of Incidents, # of issues, # of commits, Purchase Order rate.
Solutioning
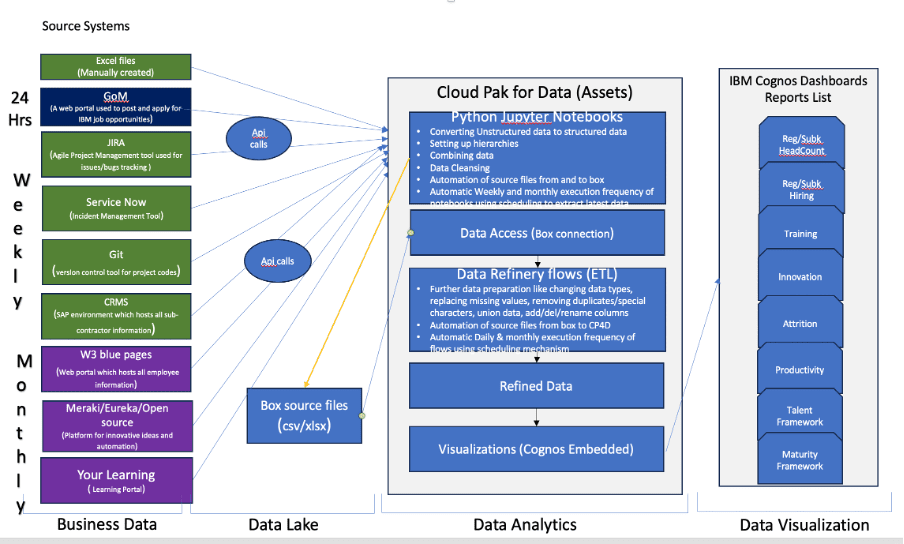
The very first part of my “solutioning,” a recently coined word in the IT space, involved identifying the source systems from where all this data is sourced. Not to my surprise, these are the source systems that are widely used: Jira, ServiceNow, GIT, Job Portal, Companies blue pages, and SAP source that hosts subcontractor data. The below diagram depicts the first part of the solutioning architecture
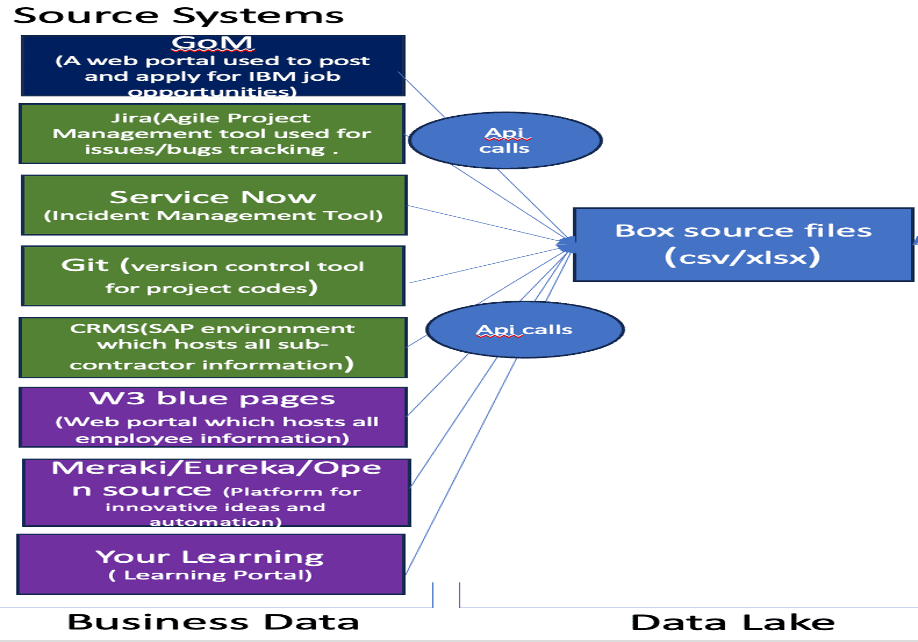
The second part of solution architecture involves extracting the data from various source systems depicted in the above diagram. To accomplish the task of extracting data, I have used Python programming language, which is one of the most powerful and user-friendly Data Science tools. Python has several of these source applications in-built libraries that it can use to fetch data via REST APIs. All the source data applications in turn support REST API where they have the ability to integrate with other applications, in this case, Python. These applications have multiple endpoints which define the level at which the information is extracted. Let me take an example of JIRA to illustrate the extraction process further. JIRA supports REST API, and it has several endpoints that are at the project level, issue level, sprint level, etc. Python, in turn, has a Jira library that it uses to connect to the JIRA tool via the REST API. The API calling can be as simple as providing inputs to Python code such as source application server name, API key, and username to login for authentication and can be a little more complicated like persisting token keys and refreshing them periodically along with authentication information for a few other applications. The complexity of API calling might vary based on the application type.

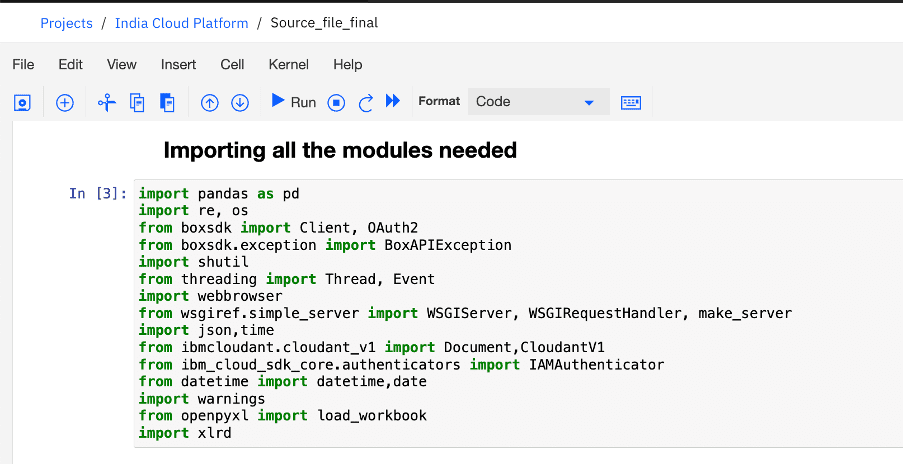
The above code snippet uses the Client function from the Python box SDK to connect to box cloud storage by authorizing the user with the help of an access token. An access token expires after 60 minutes. This access token can be re-generated periodically using a refresh token. The above code connects to an IBM NoSQL database called Cloudant which is being used to persist the previous access token and refresh token pair. Once fetched, this pair is used to generate a new set of access tokens and refresh tokens which is then used to authorize the box SDK Client and is then stored back into the Cloudant Database.
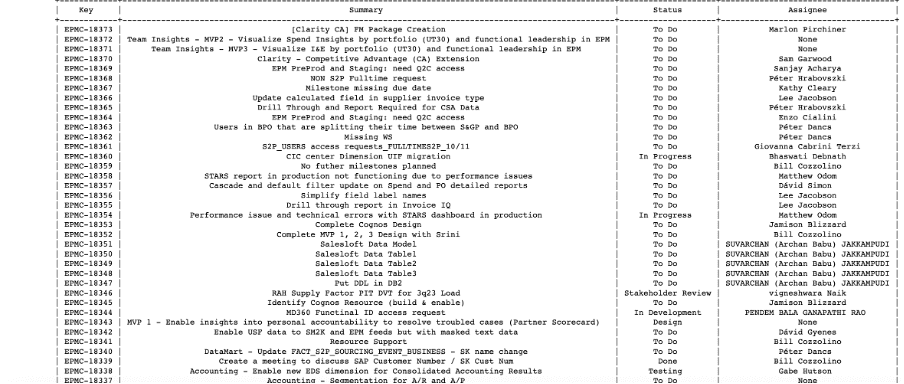
The extracted data from some of these web applications can be as clean as tabular data.
Once the data is extracted, the third part of the solutioning includes refining of the data. Often, the data that is extracted comes in an unstructured format with special characters, lists in cells, free text, measures/dates in column format, duplicates, incorrect data types, etc. Python supports very powerful and efficient libraries to convert this data into a more structured format suitable for further OLAP-style data analysis. Below are some of the libraries and functions used in accomplishing the task of refining & structuring the data
- Pandas
- re
- Numpy
- Glob
- Excel libraries (openpyxl,xlrd)
- Application libraries (jira, requests,git)
- Explode
- Groupby
- Json
- Boxsdk
- PrettyTable
- Datetime
Example scenario of refining data.
A source extract can have lot of special characters and free-form text. Using a combination of Regex patterns and explode function can fix these issues.

The given code snippet takes care of the process of data cleaning and data preparation. It is used for the source files which have a high level of data inconsistency. The first part of the code is used to convert all different types of datetime formats to a standardized Date format. The next step uses regex to clean the different issues identified in the files. The pattern variable stores the pattern which is matched in all the respective columns of each sheet and the apply function uses the regex matching to create a list of all the matches per row. These matches are then separated into individual rows using the explode function. The final generated data frame is then sent back to the main function and stored as an Excel sheet which is then uploaded to the box storage.
The fourth step of a solution architecture is to identify the target data system where the refined data can be loaded. This can be thought of as a data lake. It can be an Azure data lake, or a simple cloud storage application like Box, Snowflake, etc. Take the example of Box. It is a cloud storage system and I have used this as my data lake. All the refined data is loaded into the Box in the form of flat files. This can further be fed into RDBMS tables and use data warehousing principles (Star Schema, Primary Key/Foreign Key, Dimensions, Facts) or can be directly consumed by one of the Business Intelligence tools. I took the latter approach.
The fifth part of solutioning involves feeding the data into an ETL tool or a business intelligence tool directly like Power BI or Tableau where ELT(Extract Load Transform) process can be performed. I adapted the first approach of loading the data from refined files from previous steps into an ETL(Extract Transform Load) tool. This process involves creating a connection to the source data lake (in this case Box). Further transformation steps can be applied like renaming the columns, adding/removing columns, calculations, setting up aggregation properties, and Unioning data. This whole process of feeding the data from data lake into ETL, applying transformation steps and creating data assets is performed in IBM Cloud technology called Cloud Pak for Data (CP4D) as shown below in the updated architecture. This is a single centralized platform of Jupyter Notebooks, Data Connections, Data refinery flows, Data Assets, Visualizations.
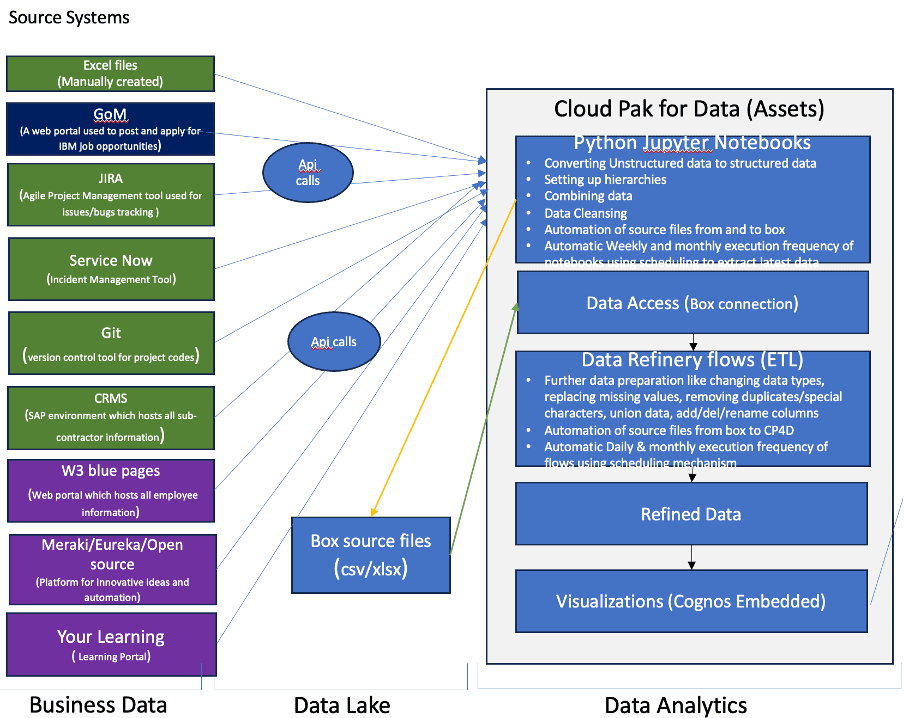
The final part of solutioning architecture is drawing visualizations from data assets. Data assets are synonymous with target tables that you can connect to any Visualization tool like Power BI, Tableau, or Cognos. In our case, there is an in-built Cognos dashboarding and visualizations provision available in CP4D, Cognos Embedded, which can be leveraged to create data visualizations. This is like an end product where stakeholders, leaders, and management of the business, department of an organization can view the data in graphical representation and make strategic and informed decisions. Various visualizations like MoM (Month-on-Month) trend line charts, tabular view, Heatmaps, Geography maps, Column, Stacked Column, Bar, and Stacked Bar, Combination charts can be used to show KPI information in combination with different attributes or dimensions of data like Leader, Manager, Global Manager, Region, Country Category, Business Unit, Service groups etc. End users are given options to select filters which helps them narrow down the scope specific to their departments or business units. Furthermore, the data refresh frequencies of these dashboards, reports, and visualizations can be set at different levels of the implementation process like Jupyter Notebooks or ETL flows using the in-built scheduling mechanisms. Below are the complete Architecture and sample dashboard visualizations.
Outcome:
Data Visualizations as shown below empower and enable management/ leadership to make informed business decisions on various areas of HR like Headcount forecasting, Market Entry & exit strategy, Retention management planning, Headcount cost management, and so forth. This solution can be extended to different domains like banking, manufacturing, pharma, health care, etc.
The information in the visuals below are masked due to the confidentiality of real data


In conclusion
Leveraging data science with analytics technologies can help organizations in a paradigm shift from PowerPoints and Excel analysis to advanced visualizations, statistical analysis, and even predictive models by consistent integration of data from many source systems like a simple text file to complicated big data coming from social media. With correct expertise and skillset around these areas and with proper exploration of capabilities of such advanced technologies, data analysis from hidden KPIs has made it possible for businesses to identify the gaps, find solutions, and make them more profitable.