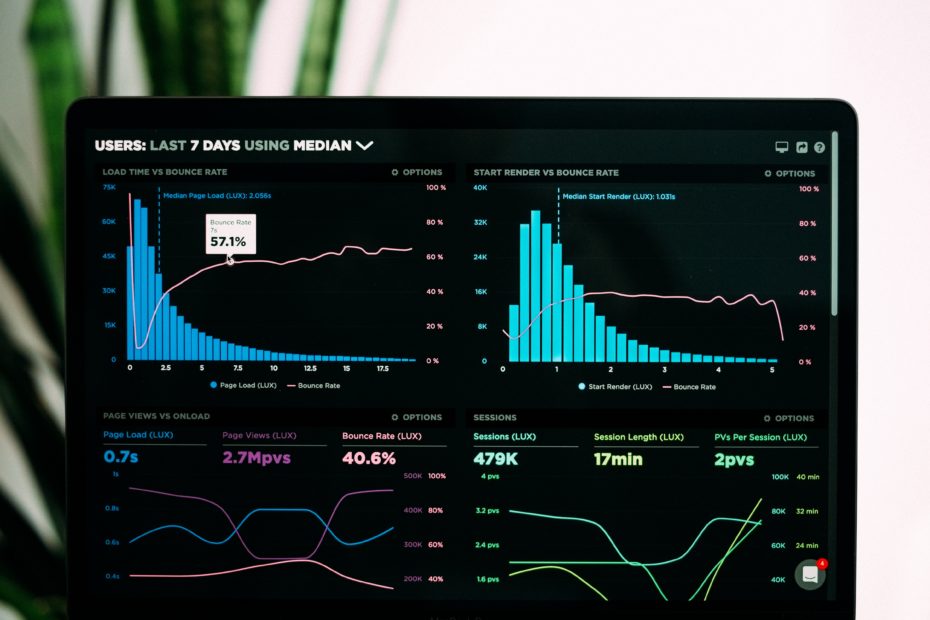
The Value of Real-Time Data Visualization and Interpretation

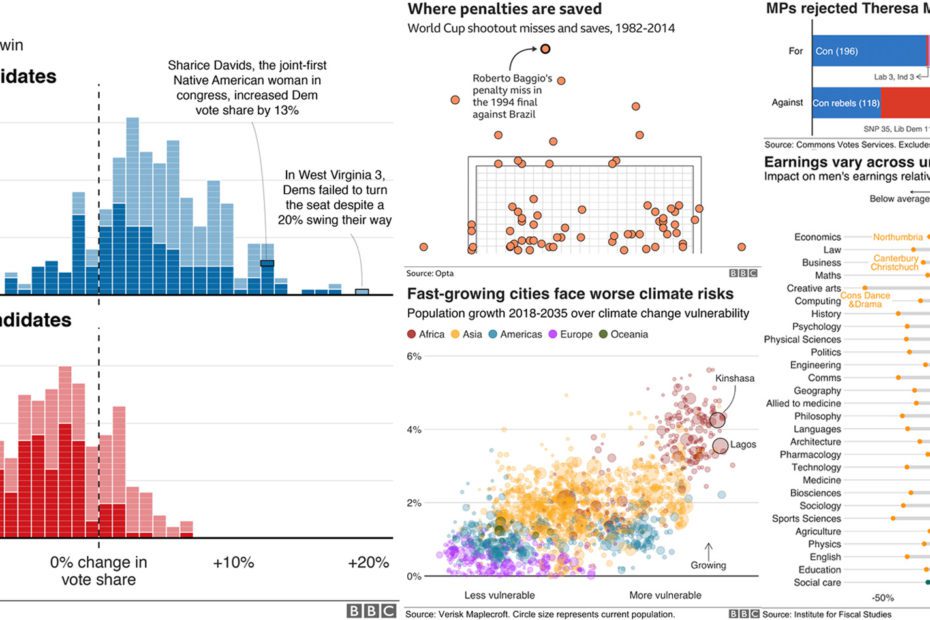
Data representation using graphics such as charts, plots, infographics, heat maps, bubble clouds, scatter plots, mekko charts are referred to as data visualization. Such visual displays and representations of information help communicate complex data relationships and data-driven insights in a way that makes it easy to understand and base decisions on.