
I spent much of my career in business intelligence and marketing. Programming in R was never one of my top skills. While I started programming in R more than 30 years ago, it was never one of my core activities either. Yet I have a background in machine learning and image processing. So I know how to produce high quality graphics.
To me, despite the fact (especially decades ago) that people use R to produce all sorts of graphics, I’ve found R plots to be of poor quality. But it does not need to be that way. The purpose of this article is to share a workaround with you. I believe it will be most useful to professionals who are not programmers, but occasionally use basic R scripts to produce images. It does not involve using the ggplot2 library and its obscure syntax. It is indeed much easier than that.
I did some research to make sure the proposed fix in this article is not an obscure trick that only people with rusty programming skills use. The Cairo graphics library is indeed available in many languages including Python, not just R. Its main feature (the one I was attracted to) is its anti-aliasing capabilities when creating shapes such as lines or circles. Without anti-aliasing, lines (for instance) appear as broken segments. It looks low resolution and pretty ugly. This is still the way it works today when using R plots.
Example
Before digging into the details, let me show you the contrast between an image with anti-aliasing, and one lacking it.
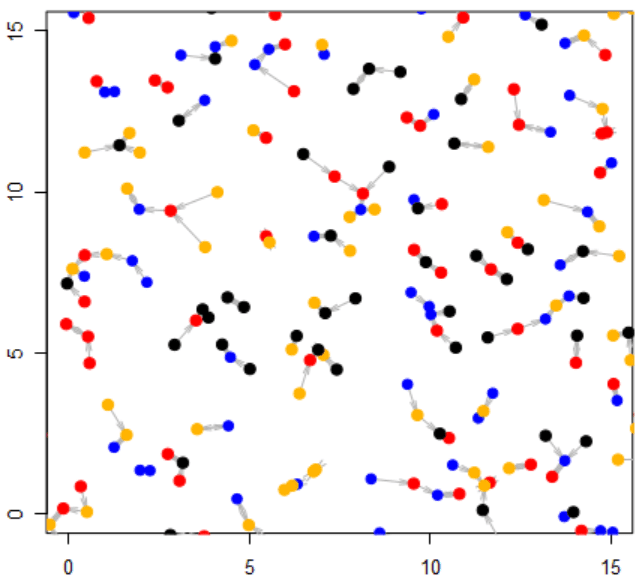
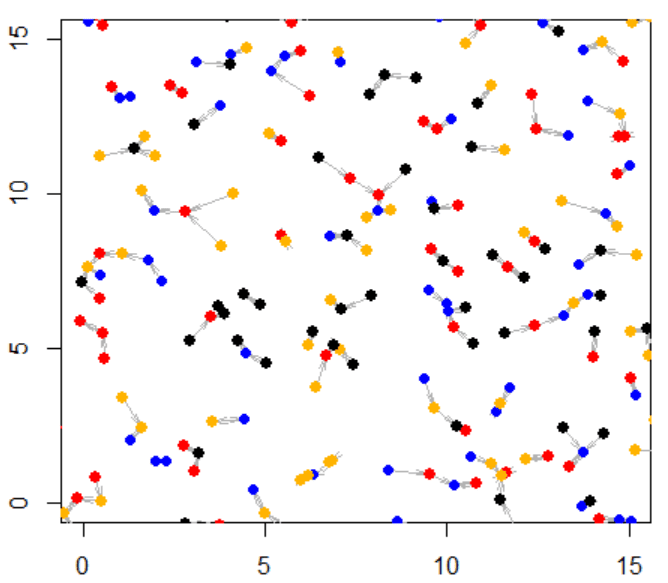
Depending on which device you use to read this article (assuming it does not add its anti-aliasing and renders the image unchanged), the poor resolution is very apparent in the bottom plot, lacking anti-aliasing. If not, zoom-in to see the details. The dots are not round, they look like cog wheels. The arrows are poorly rendered.
The Fix
The fix consists of two lines of code in R. First, you need to install the Cairo library with the command
> install.packages('Cairo')
The first two lines in your R script would look like:
> library('Cairo');
> CairoWin(5,5);
The second line is to create a high resolution window on your screen, to replace the standard R graphics window. For a bigger window, try CairoWin(6, 6). If instead you would like to save the image as a PNG file, replace the second line of code by something like
> CairoPNG(filename = "c:/Users/yourname/nice.png", width = 600, height = 600);To actually generate the PNG image, add the following at the bottom of your script:
> dev.off()Here we go! By the way, the image represents nearest neighbors (connected by arrows) after superimposing four stochastic point processes – each one featured with a different color. I use it to illustrate the size distribution of connected components in a peculiar type of random graph based on nearest neighbors. More about this in my upcoming book.
See CairoGraphics.org for details, or the Wikipedia entry about it. The full version of my R script is available on my GitHub repository, here. It uses an input file, also available in the same repository, here.
About the Author

Vincent Granville is a pioneering data scientist and machine learning expert, founder of MLTechniques.com and co-founder of Data Science Central (acquired by TechTarget in 2020), former VC-funded executive, author and patent owner. Vincent’s past corporate experience includes Visa, Wells Fargo, eBay, NBC, Microsoft, CNET, InfoSpace. Vincent is also a former post-doc at Cambridge University, and the National Institute of Statistical Sciences (NISS).
Vincent published in Journal of Number Theory, Journal of the Royal Statistical Society (Series B), and IEEE Transactions on Pattern Analysis and Machine Intelligence. He is also the author of multiple books, available here. He lives in Washington state, and enjoys doing research on stochastic processes, dynamical systems, experimental math and probabilistic number theory.