This article comes from CNN Money. It was written by the associate international editor of CNN Money, Charles Riley. If robots are going to steal human jobs and otherwise...
Originally posted on Analytic Bridge The big data blast has given rise to a host of information technology software and tools and abilities that enable companies to ...
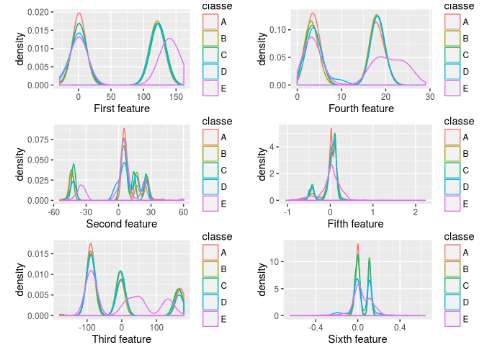
Choosing features to improve a performance of a particular algorithm is a difficult question. Currently here is PCA, which is difficult to understand (although it can be ...
Using the Genalg Package in R to optimize Legal Fees. This is a Lesson from our Data Science for Lawyers Workshops (Moderately Advanced). We’d appreciate any Feed ...
Guest blog post by Kenneth Soo, originally posted here. Take a look at the picture below and try to identify what it is: One should be able to tell that it is a giraff...
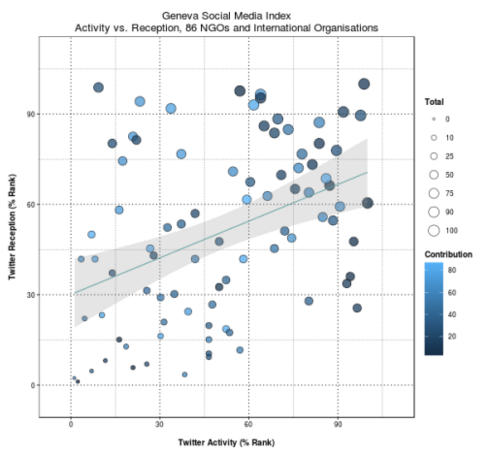
If you read our digests, you already know that each week, we publish our picture of the week. Below is a selection from the last few months. By clicking on the link asso...
Big data and its conjoined twin analytics are the business buzzwords of the decade to be sure — and for good reason. Because of advances in technology and computing, we...
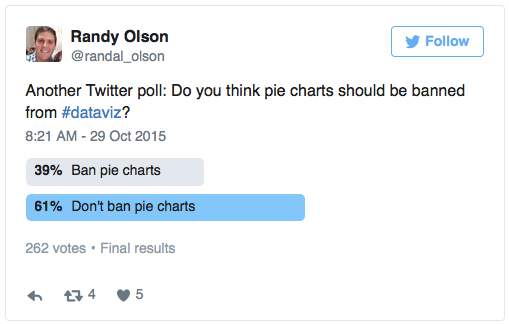
Oh, the poor, maligned pie chart. The chart type that gets pushed around and bullied on the data-viz playground more than any other. Randal Olsen of /r/dataisbeautiful ra...
Previous Relevant Posts Single regression with R to identify relationship between WTI and s… Getting stock volatility in R & Getting Histogram of returns What i...
Guest blog by Sebastian Raschka, originally posted here. If we tackle a supervised learning problem, my advice is to start with the simplest hypothesis space first. I....