Introduction Edmond de Bellamy, from La Famillie de Bellamy created by Obvious, a French group; was auctioned and sold for $432,500 at Christie´s, a British auction hous...
The Data Scientist Need for Hosted Dashboards As data people, we very typically spend a great deal of time summarizing our findings to stakeholders in a clear, concise an...
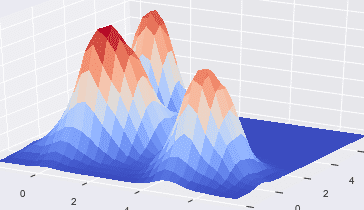
Data scientists and predictive modelers often use 1-D and 2-D aggregate statistics for exploratory analysis, data cleaning, and feature creation. Higher dimensional aggre...
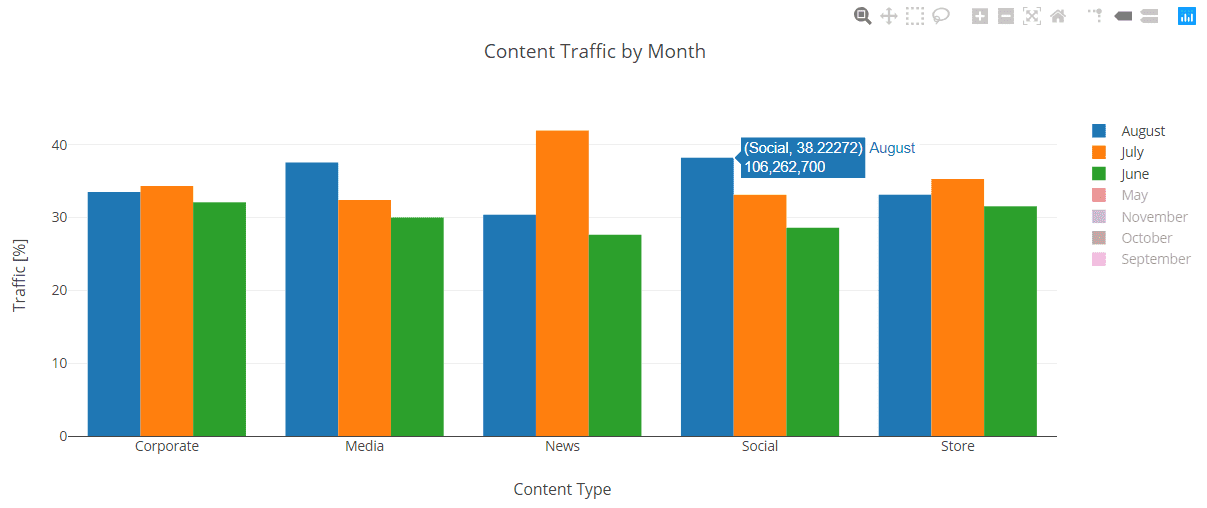
The chart is a visual representation of data in a clear and simple manner. This type of visualization is often used to increase the level of comprehension, especially in ...
Here is one of the most viral videos about data science posted in the last few months, with over 500,000 views. I could not locate the original copy; I found it in a re-t...
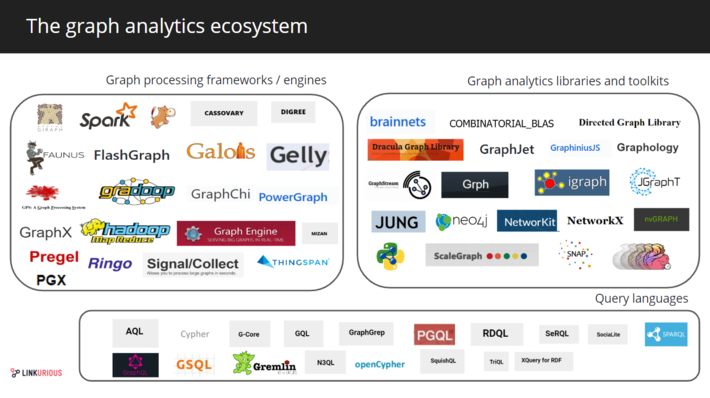
Read part 1 – The graph database landscape The graph analytics landscape 2019 Graph analytics frameworks consist of a set of tools and methods developed to extract ...
Artificial intelligence has been fascinating to the human imagination since the term was first used by the first science fiction writers. The roots of the concept of R...
Analyzing campaign efficiency with Pivot Billions Managing data just keeps getting tougher. The more we think we’ve gotten a handle on our data the more it grows and be...
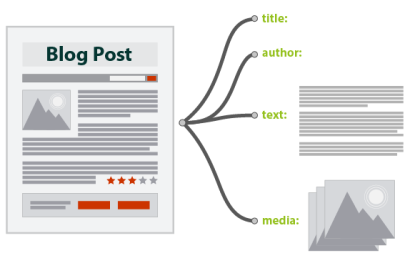
Introduction : Web scraping or crawling is the process of extracting data from any website. The data does not necessarily have to be in the form of text, it could be imag...
This resource is part of a series on specific topics related to data science: regression, clustering, neural networks, deep learning, Hadoop, decision trees, ensembles, c...