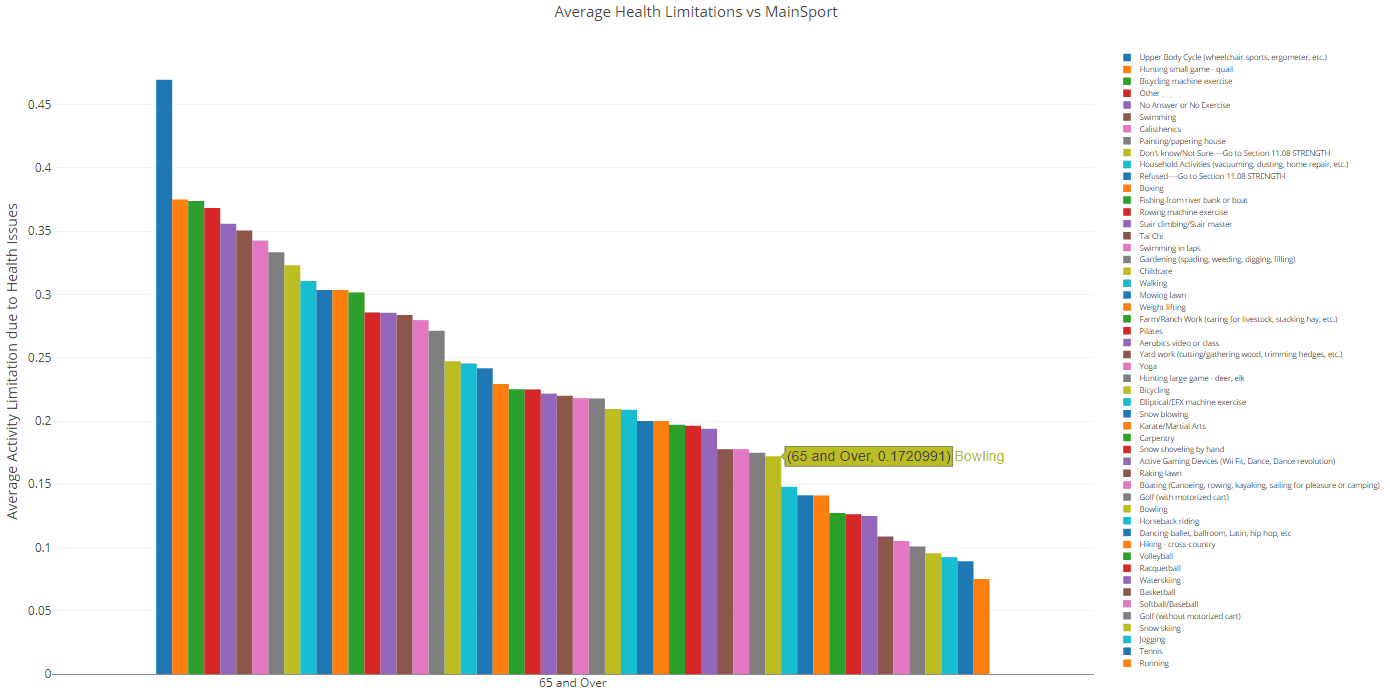
Diving into CDC Behavioral Risk Factor data using Pivot Billions to learn what exercise behaviors are associated with improved health. Motivating yourself to go outside a...
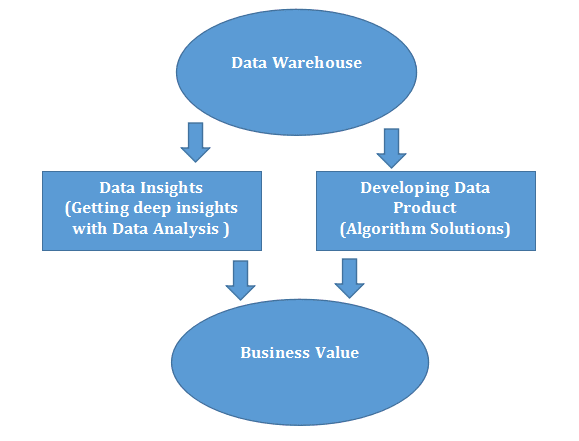
Data Science is a combination of data inference, algorithms, and technology that solves complex problems. The core of this technology is data that is initially raw, then ...
This is another interesting problem, off-the-beaten-path. It ends up with a formula to compute the integral of a function, based on its derivatives solely. For simplici...
The following articles were hand-picked, and curated by one of our interns. They cover dozens of topics of interest to data scientists. Precision vs significance / accu...
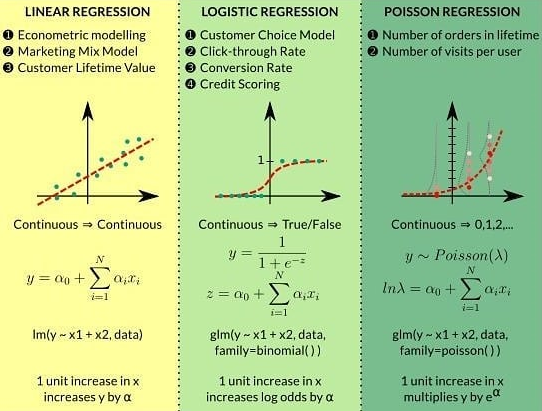
Interesting picture comparing linear, logistic and Poisson regression, found here. For more about regression, read our other articles on this subject, here. For other ML ...
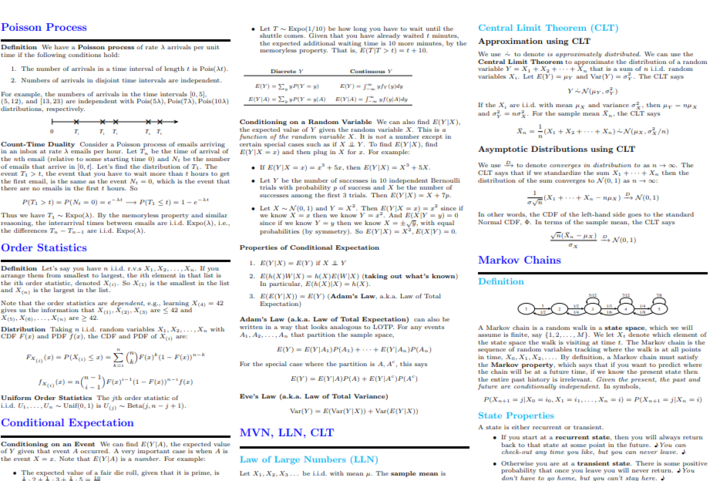
Below is an extract of a 10-page cheat sheet about probability, compiled by William Chen (http://wzchen.com) and Joe Blitzstein, with contributions from Sebastian Chiu, Y...
Measuring the similarity between texts is a common task in many applications. It is useful in classic NLP fields like search, as well as in such far from NLP areas as med...
Introduction Edmond de Bellamy, from La Famillie de Bellamy created by Obvious, a French group; was auctioned and sold for $432,500 at Christie´s, a British auction hous...
The Data Scientist Need for Hosted Dashboards As data people, we very typically spend a great deal of time summarizing our findings to stakeholders in a clear, concise an...
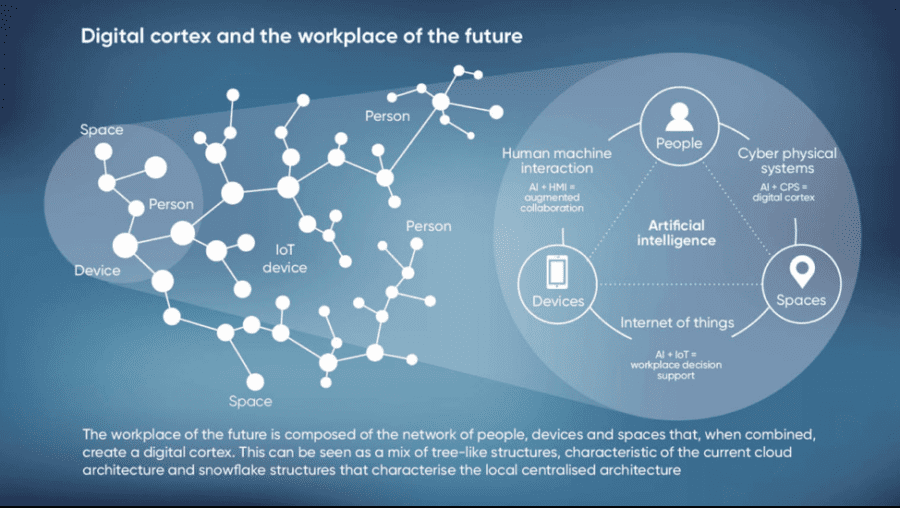
The article “Cognitive Hub: The Future of Work” and the supporting infographic (see Figure 1) provides an interesting perspective on some “technology combinations...