
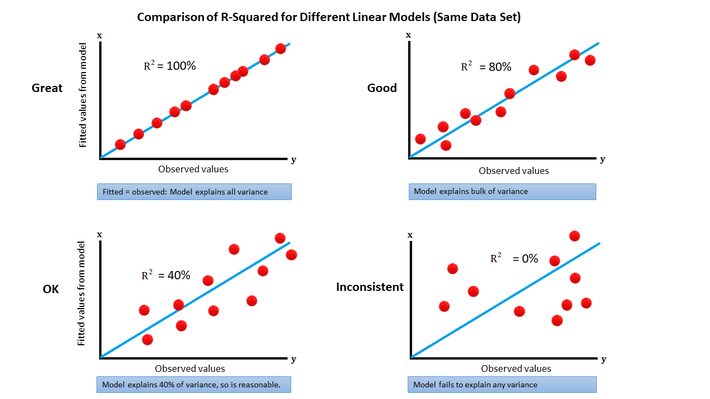
R-squared measures how well your data fits a regression line. More specifically, it’s how much variation in the response variable your linear model explains. it is expressed as a percentage (0 to 100%). The percentage is problem specific, so you can’t compare R-squared across different situations; You can use it to compare different models for one specific set of data.
R-squared is also influenced by the number of observations: 0.80 R-squared on 100 observations doesn’t mean the same thing as 0.80 R-squared on 1,000 observations. One way around this is to compute R-squared on multiple sub-samples with 100 observations, then compute its median. That way, you can compare an R-squared on (say) 1,000 observations, with one on 100 observations. See here how this works.
For more statistical concepts explained in one picture, follow this link.