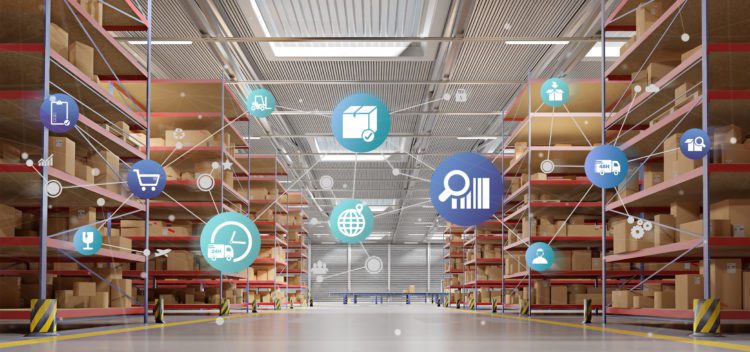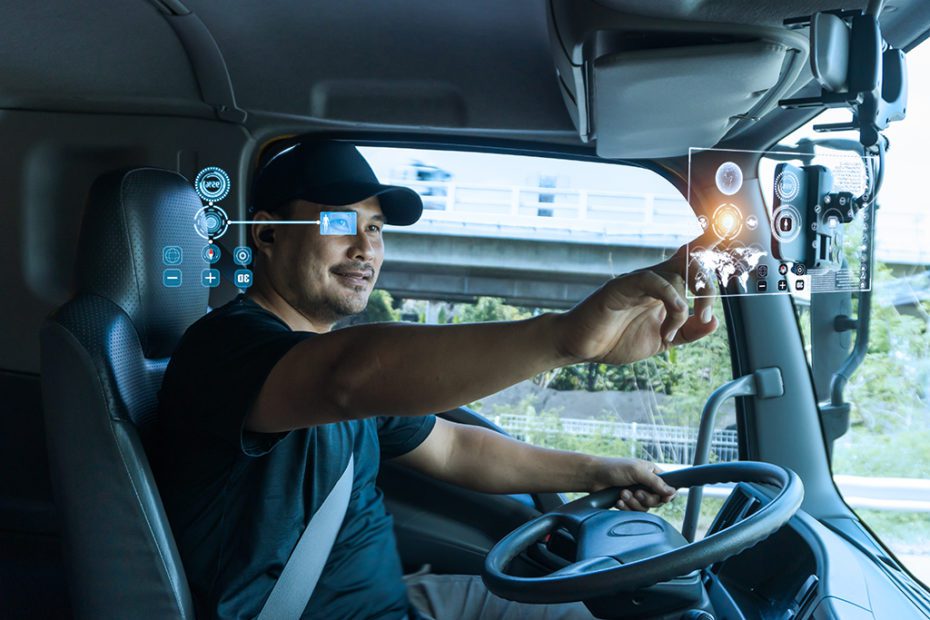
How Technology Aims to Revolutionize Trucking

If you look around your room, chances are that most of the things there travelled at some stage in a truck. Trucks are responsible for moving around 70 percent in the U.S. and it employs 7 million people, fifty percent of which are drivers. While technology has been improving lives in every field but the jobs of truck drivers still remain very tough. According to one estimate, some truckers walk about 3000 miles every week. However, like everything else, technology is set to alter the future of this industry. I will try to explain briefly how.