Visualizing Survey Data
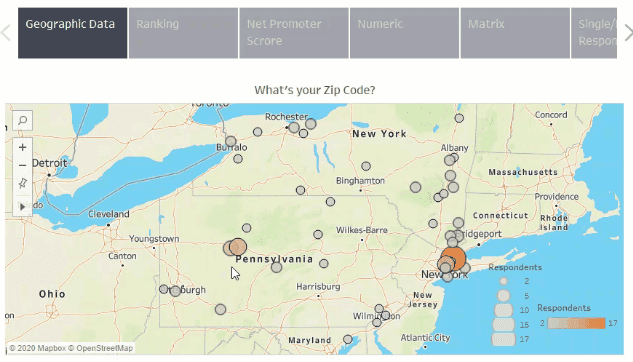
In this post, we will be visualizing survey data for the top survey question types. I’m Tyler Lubben, founder of VizualSurvey, a survey data cleaning tool… Read More »Visualizing Survey Data
This rubric focuses on computer vision, and how computers can gain high-level understanding from data derived from digital images or videos. Topics also include haptics and other examples of computer sensory input, as well as concepts such as generative adversarial networks and AI-driven image recognition.

In this post, we will be visualizing survey data for the top survey question types. I’m Tyler Lubben, founder of VizualSurvey, a survey data cleaning tool… Read More »Visualizing Survey Data


In this article, we will examine whether the gasoline prices are related to the variables that are thought to affect gasoline prices the most by… Read More »Testing the Correlation between Time Series Variables

In supervised machine learning algorithms, Random Forest stands apart as it is arguably the most powerful classification model. When Microsoft developed their X-box game which… Read More »Random Forest Classification explained in detail and developed in R
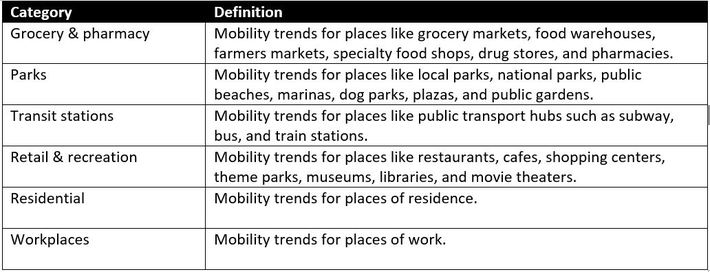

Using Google Mobility Data to Model Covid-19 Case Infection Rates Paul B. Parker, Ph.D. Introduction The question of how and when to open up the… Read More »Using Google Mobility Data to Model Covid-19 Case Infection Rates
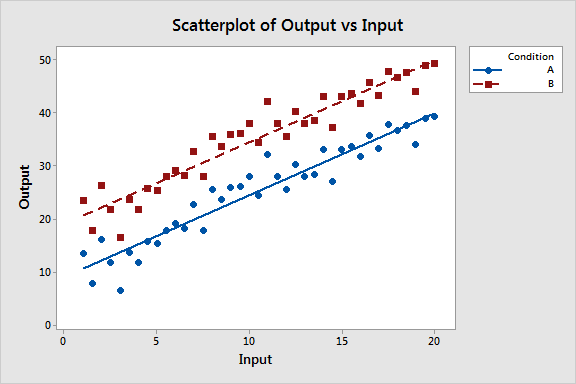

This article was written by Jim Frost. How do you compare regression lines statistically? Imagine you are studying the relationship between height and weight and… Read More »Comparing Regression Lines with Hypothesis Tests
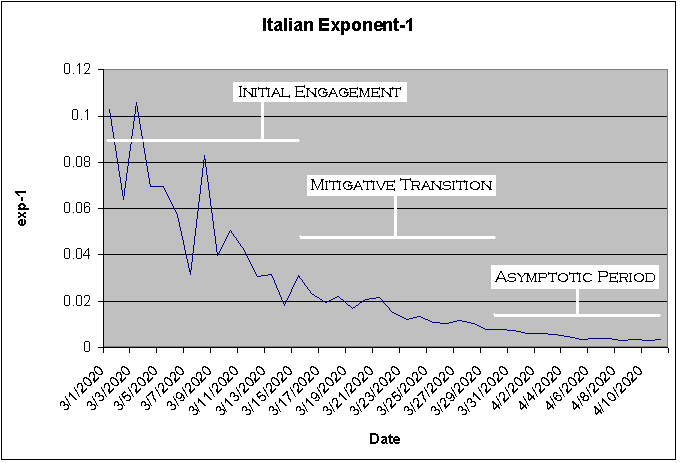

While I was laid off due to the new Coronavirus, I created a computer application called Little Blue Pearl (LBP) – named after our planet.… Read More »Technical Periods of COVID-19 Fatality Data and the Relevance of Asymptotic Baselines


KernelML – Hierarchical Density Factorization The purpose, problem statement, and potential applications came from this post on datasciencecentral.com. The goal is to approximate any multi-variate distribution using… Read More »New Algorithm For Density Estimation and Noise Reduction
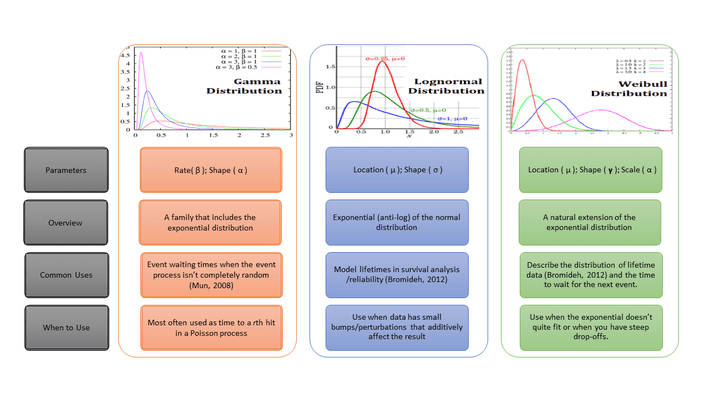

At first glance, the Lognormal, Weibull, and Gamma distributions distributions look quite similar to each other. Selecting between the three models is “quite difficult” (Siswadi &… Read More »Lognormal, Weibull, and Gamma distribution in One Picture

Data science is all about extracting the information from the data gathered. As data has become one of the essential entities in today’s world, it drives… Read More »Data Visualization 101: 4 Tips To Convert Data To Information Quickly
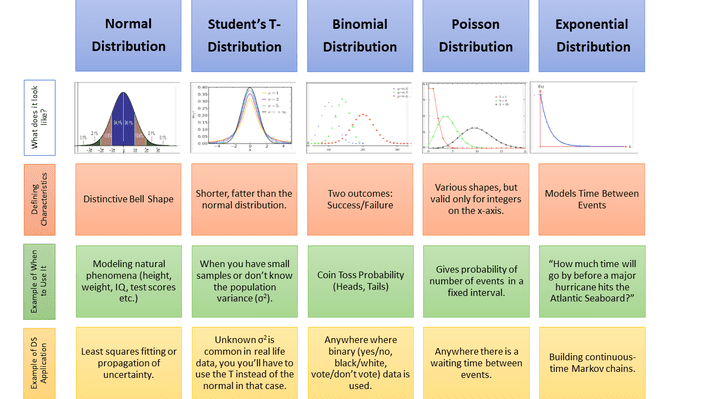
Data science uses many different probability distributions, but some are used more than others. This one picture shows an overview of five probability distributions data… Read More »Different Probability Distributions in One Picture