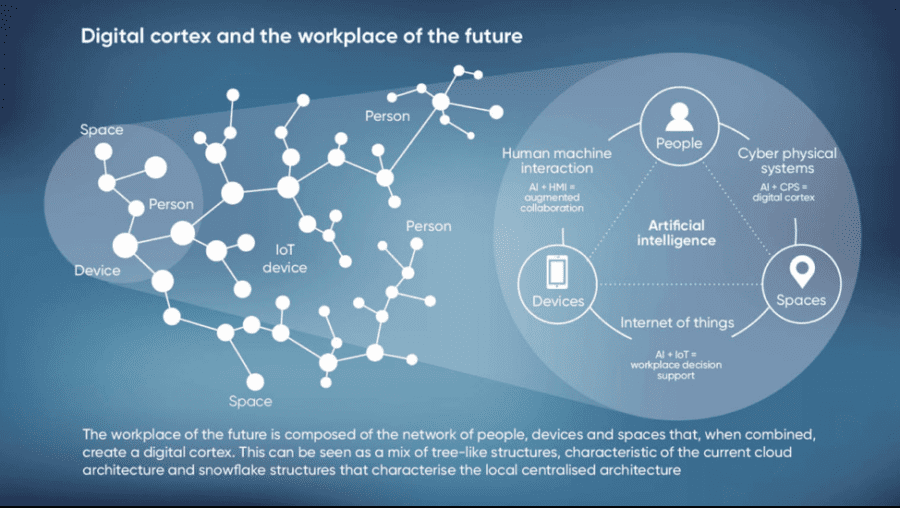
The article “Cognitive Hub: The Future of Work” and the supporting infographic (see Figure 1) provides an interesting perspective on some “technology combinations...
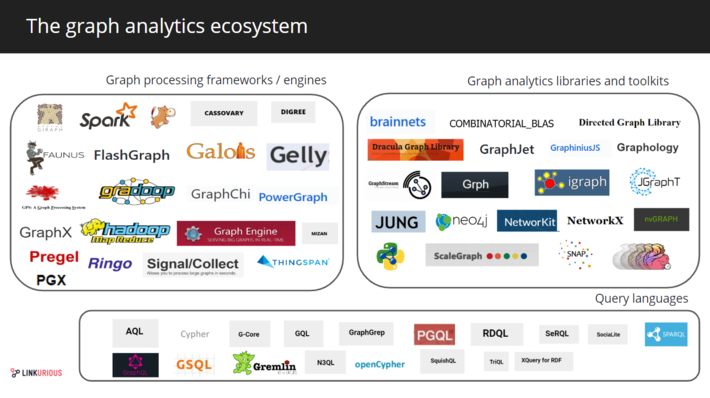
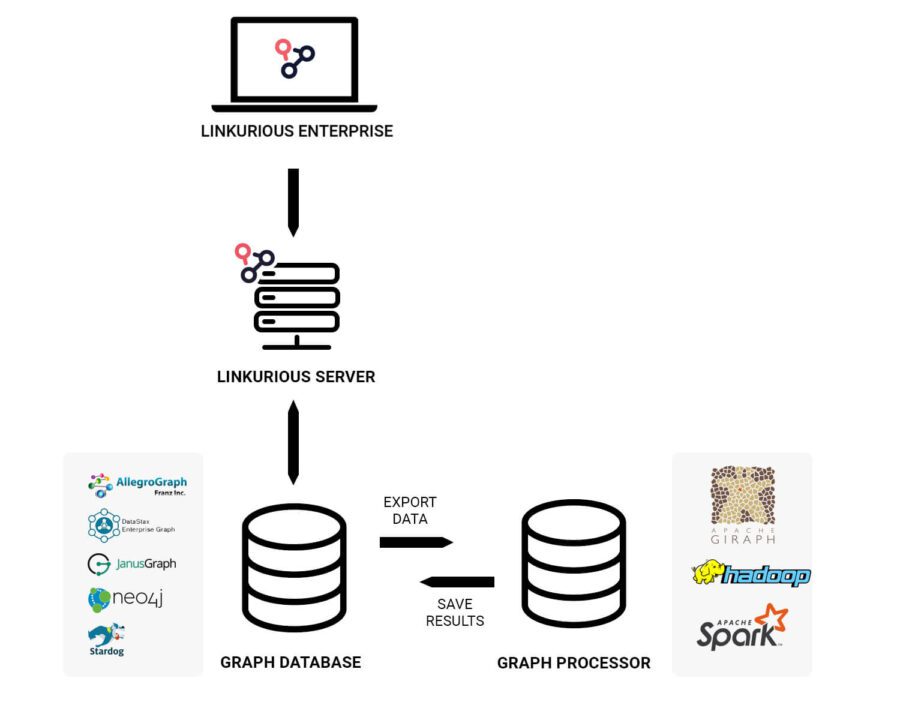
Read part 1 – The graph database landscape The graph analytics landscape 2019 Graph analytics frameworks consist of a set of tools and methods developed to extract ...
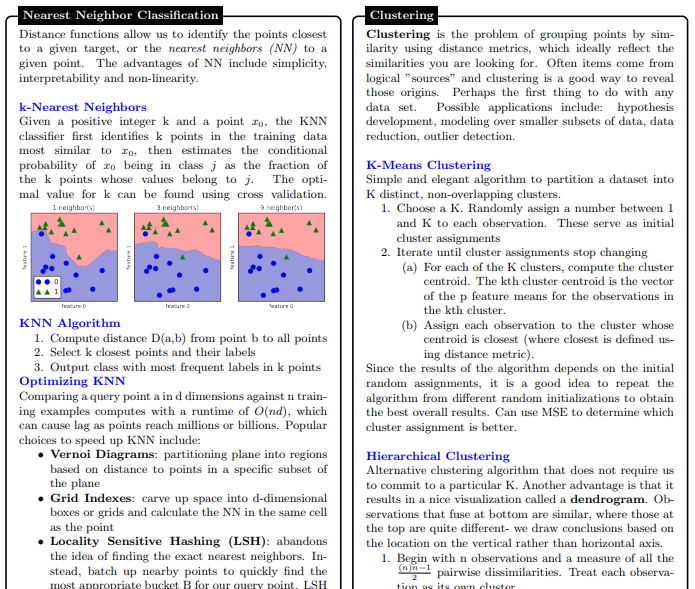
Below is an extract of a 10-page cheat sheet about data science, compiled by Maverick Lin. This cheatsheet is currently a reference in data science that covers basic conc...
What if you could directly ask questions of your data? Ask Data, Tableau’s new natural language capability, allows people to get insights by simply conversing with thei...
After posting my most recent blog using census data to illustrate handling “large” dataframes in R exploiting fst and feather file formats, I realized I c...
Originally posted here. From detecting anomalies to understanding what are the key elements in a network, or highlighting communities, graph analytics reveal...
Data blending is the foundation for all analysis, which is why analysts reside in every department and within every industry. Yet not all analysts are driving the busines...
IBM, the 92nd in the Top 100 in the Fortune Global 500 list in 2018, according to the own Fortune Magazine websites, http://fortune.com/global500/ibm/, and IBM, as we kno...
Tableau is an innovative system of business intelligence enterprise-class, which can be used in both conventional and complex investigations: from visualization of questi...