

How much money is your organization leaving on the table by not being more effective at leveraging data and analytics to power your business?
This question is becoming more and more relevant for all organizations of all sizes in all industries as AI / ML capabilities become more widely available. And nothing highlights the costs of not becoming more effective at leveraging data and analytics to power your business models then a recent study by Kearney titled “The impact of analytics in 2020″.
There are lots of great insights in this report. One of my favorites is the Analytics Impact Index which shows the potential profitability gap of Laggards, Followers, and Explorers vis-a-vis Analytics Leaders (see Figure 1)!
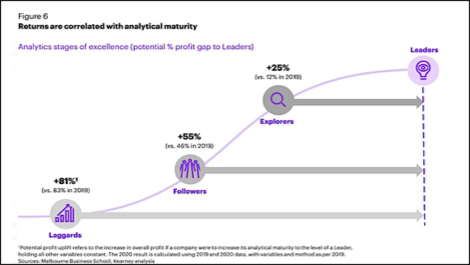
Figure 1: Analytics Impact Index by Kearney
Figure 1 states that from a potential profitability perspective:
- Explorers could improve profitability by 20% if they were as effective at Leaders
- Followers could improve profitability by 55% if they were as effective at Leaders
- Laggards could improve profitability by 81% if they were as effective at Leaders
Hey folks, this is a critical observation! The Kearney research puts a potential cost on being an analytics laggard (or follower or explorer), and the money being left on the table is significant. The Kearney research highlights the business-critical nature of the question:
How effective is your organization at leveraging data and analytics to power your business models?
This is the same question that asked when I released the Big Data Business Model Maturity Index in November 27, 2012. I developed the Big Data Business Model Maturity Index to help organizations understand the realm of the possible for becoming more effective at leveraging data and analytics to power their business models. The Big Data Business Model Maturity Index served two purposes:
- Provide a benchmark against which clients could contemplate (if not answer) that data and analytics effectiveness question, and
- Provide a roadmap for becoming more effective at leveraging data and analytics to power their business models.
I refreshed the Big Data Business Model Maturity Index to reflect the changes in advanced analytics (and the integration of design thinking) since I first created the chart. I’ve renamed the chart Data & Analytics Business Maturity Index to reflect that the business challenge is now more focused on the integration of data and analytics (not just Big Data) with the business to deliver measurable, material, and relevant business value (see Figure 2).
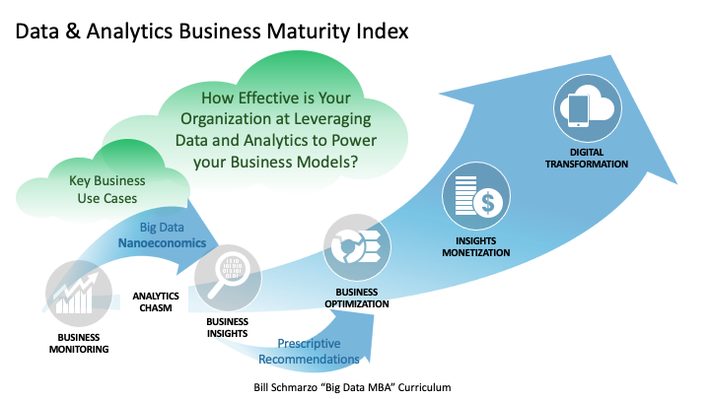
Figure 2: Data & Analytics Business Maturity Index
Unfortunately, the Kearney research was a little light on explaining the differences between Laggards, Followers, Explorers, and Leaders phases, and in providing a roadmap for navigating from one phase to the next. So, let’s expand on the characteristics of these phases, and provide a roadmap, using my 5-phase of Data & Analytics Business Maturity Index.
Understanding the Data & Analytics Business Maturity Index
To become more effective at leveraging data and analytics to power your business, we need a definition of the 5 phases of the Data & Analytics Business Maturity Index so that you can 1) determine where you sit vis-Ã -vis best-in-class data and analytics organizations and 2) can determine the realm of whats possible in leveraging data and analytics to power your business models.
- Phase 1: Business Monitoring. Business Monitoring is the traditional Business Intelligence phase where organizations are collecting data from their operational systems to create retrospective management reports and operational dashboards that monitor and report on historically what has happened.
- Phase 2: Business Insights. Business Insights is where organizations are applying data science (machine learning) to the organizations internal and external data to uncover and codify customer, product, and operational insights (or predicted propensities, patterns, trends, and relationships) for the individualized human (customers, patients, doctors, drivers, operators, technicians, engineers) and/or device (wind turbines, engines, compressors, chillers, switches) that predicts likely outcomes.
- Phase 3: Business Optimization. Business Optimization is where organizations are operationalizing their customer, product, and operational insights (predicted propensities) to create prescriptive recommendations that seek to optimize key business and operational processes. This includes the creation of intelligent apps and smart products or spaces and holistic data instrumentation that continuously seeks to optimize operational performance across a diverse set of inter-related use cases.
- Phase 4: Insights Monetization. Insights Monetization is where organizations are monetizing their customer, product, and operational insights (or predicted propensities) to create new, market-facing monetization streams (such as new markets and audiences, new channels, new products and services, new partners, and new consumption models.
- Phase 5: Digital Transformation. Digital Transformation is where organizations have created a continuously learning and adapting culture, both AIdriven and humanempowered, that seeks to optimize AI-Human interactions to identify, codify, and operationalize actionable customer, product, and operational insights to optimize operational efficiency, reinvent value creation processes, mitigate new operational and compliance risk, and continuously create new revenue opportunities.
Note #1: Phase 4 this is NOT Data Monetization (which infers a focus on selling one’s data). Instead, Phase 4 is titled Insights Monetization which is where organizations are focused on exploiting the unique economic characteristics of data and analytics to derive and drive new sources of customer, product, and operational value.
Note #2: I am contemplating changing Phase 5 from Digital Transformation to Cultural Transformation or Cultural Empowerment for two reasons.
- First, too many folks confuse digitalization, which is the conversion of analog tasks into digita…. For example, digitalization is replacing human meter readers, who manually record home electricity consumption data monthly, with internet-enabled meter readers that send a continuous stream of electricity consumption data to the utility company.
- Second, it isnt just technology that causes transformation. We just saw how the COVID19 pandemic caused massive organizational transformation. Yes, transformations can be forced upon us by new technologies, but transformations can also be caused by pandemics, massive storms, climate change, wars, social and economic unrest, terrorism, and more!
The Roadmap for Mastering Data & Analytics
Now that we have defined the characteristics of the 5 phases of the Data & Analytics Business Maturity Index, the next step is to provide a roadmap for how organizations can navigate from one phase to the next. And while Data & Analytics Business Maturity Index in Figure 3 is sort of an eye chart, it is critical to understand the foundational characteristics of each phase in advancing to the next phase.
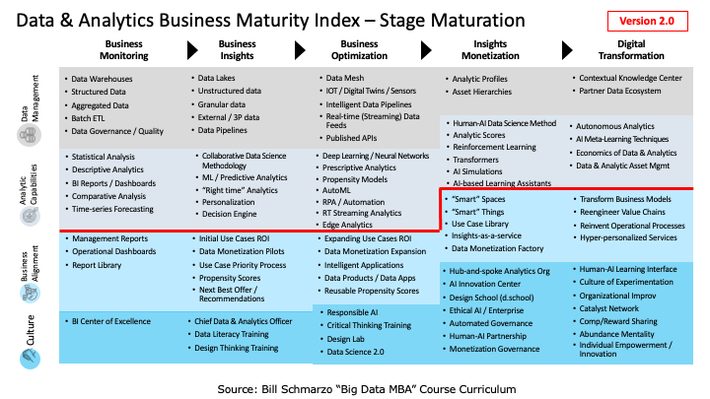
Figure 3: Data & Analytics Business Maturity Index Roadmap (version 2.0)
What I found interesting in Figure 3 is how the importance of Data Management and Analytic Capabilities – which are critical in the early phases of the Data & Analytics Maturity Index- are replaced in importance by Business Alignment (think Data Monetization) and Culture (think Empowerment). I think this happens for several reasons:
- Organizations build out their data and analytic capabilities in the phases. And if organizations are properly curating their data assets (think data engineering, DataOps, and data lake as collaborative value creation platform) and engineering composable, reusable, continuously-learning analytics assets, then the data and analytics can be used across an unlimited number of use cases at near-zero marginal cost (see my Economics of Data and Analytics research captured in my new book “The Economics of Data, Analytics, and Digital Transformation”). Yes, once you have curated your data and engineered your analytics properly, then the need to add new data sources and build new analytic assets declines in importance as the organization matures!
- The Insights Monetization phase requires business leadership to envision (using design thinking) how the organization can leverage their wealth of customer, product, and operational insights (predicted propensities) to create new monetization opportunities including new markets and audiences, new products and services, new channels and partnerships, new consumption models, etc.
- Finally, to fully enable and exploit the AI-Human engagement model (that defines the Digital Transformation phase) requires the transformation of the organizational culture by empowering both individuals and teams (think Teams of Teams) with the capabilities and confidence to identify, ideate, test, learn, and create new human and organizational capabilities that can reinvent value creation processes, mitigate new operational and compliance risk, and continuously create new revenue opportunities.
Ultimately, it is Business Alignment (and the ability to monetize insight) and Culture (and the empowerment of individuals and teams to create new sources of value) that separates Laggards, Explorers, and Followers from Leaders.
Cost of Being an Analytics Laggard Summary
The Kearney study made it pretty clear what it is costing organizations to be Laggards (as well as Followers and Explorers) in analytics. It truly is leaving money on the table.
And the Data & Analytics Business Maturity Index provides a benchmark to not only to measure how effective your organization is at leveraging data and analytics to power your business, but also provides a roadmap for how your organization can become more effective. But the market leading organizations know that becoming more effective at leveraging data and analytics goes well beyond just data and analytics and requires driving close collaboration with the business stakeholders (Insights Monetization) and creating a culture that is prepared for the continuously-learning and adapting AI-Human interface that creates an organization that is prepared for any transformational situation (Digital or Cultural Transformation).
Seems like a pretty straight-forward way to make more money!