The hidden price of not being AI-ready
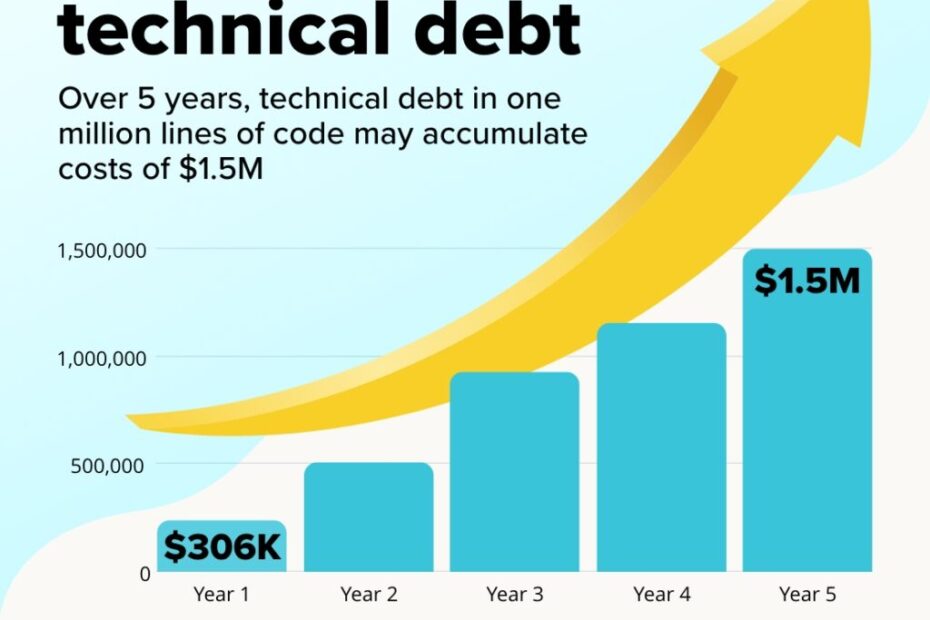
Discover the hidden price of not being AI-ready. Learn how enterprise legacy data warehouses accumulate technical debt, and calculate the true Total Cost of Inaction.

Discover the hidden price of not being AI-ready. Learn how enterprise legacy data warehouses accumulate technical debt, and calculate the true Total Cost of Inaction.


If AI can pass a CFA Level III exam in minutes, and people still say AI is not intelligent, then what else would intelligence mean?… Read More »Human intelligence research lab to rank LLMs?


Last month, OpenAI announced a strategic partnership with Nvidia, which enables the AI powerhouse to deploy 10 gigawatts of datacenters based on Nvidia’s formidable GPU… Read More »Is OpenAI creating a global compute monopoly?


Every data engineering team operates on a set of accepted principles, a playbook of “best practices” intentionally designed to ensure scalability, governance, and performance.


Across the tech sector, the term ‘AI agent’ has become Silicon Valley’s latest Rorschach test—revealing more about the speaker’s worldview than any shared technical definition.… Read More »The rise of accountable AI agents: How knowledge graphs solve the autonomy problem

Advancements in statistical AI applications for understanding and generating text have been nothing short of staggering over the past few years. Many believe it’s only… Read More »The key to conversational speech recognition
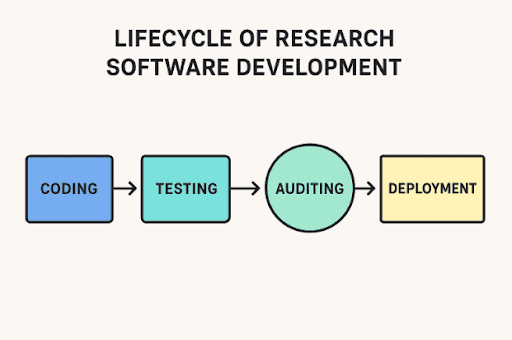

Writing software for research isn’t like making a shopping app. It often controls lab instruments, runs detailed simulations, or works through huge sets of experimental… Read More »Code audits in R&D-driven applications


Master the art of freezing layers in AI models to optimize transfer learning, save computational resources, and achieve faster training with better results.


Welcome to the series of articles on the secrets of time series modeling. Today’s edition features the nested cross-validation — a lesser-known technique that mitigates some of… Read More »Secrets of time series modeling: Nested cross-validation

Intuition alone is no longer enough for effective leadership in the modern business world. Business leaders increasingly rely on data to guide strategic decisions. Research… Read More »How business leaders are using AI to make data-driven decisions