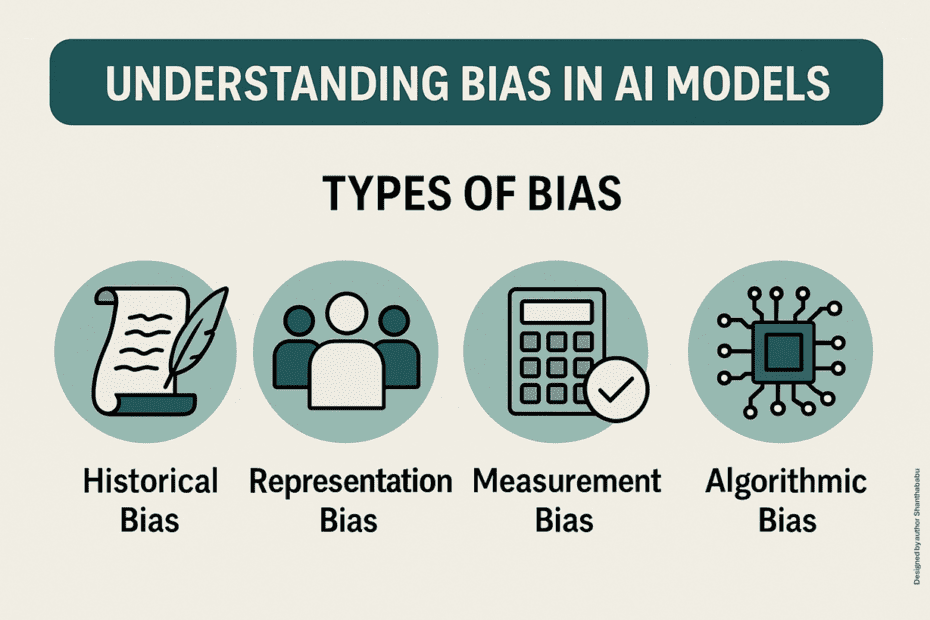
Congratulations to all Ride London participants! We enjoyed watching and supporting Prudential Ride…
ContinueAdded by Zygimantas Jacikevicius on August 8, 2016 at 12:00am — No Comments
In this short webinar watch how we help leading Investment Managers, Banks, Brokers, Asset Managers and Hedge Funds supercharge their existing investment approaches with Big Data, Semantics and Machine Learning.
Director James Phare talks about how we use machine learning algorithms, semantics and other techniques to process huge volumes of unstructured, semi structured and structured data in order to identify hidden risks and opportunities.
Learn to…
ContinueAdded by Zygimantas Jacikevicius on November 30, 2015 at 5:30am — No Comments
Data visualisation is the process of displaying data in visual formats such as charts, graphs or maps. This method is commonly used to grasp more meaning out of a snapshot of data which in other approaches might require sorting through piles of spreadsheets and great quantity of reports. With the amount of data growing rapidly it is more important than ever to interpret all of this information correctly and quickly to make well-informed business decisions.
Graph visualisation has a…
ContinueAdded by Zygimantas Jacikevicius on November 23, 2015 at 6:30am — 1 Comment
2021
2020
2019
2018
2017
2016
2015
2014
2013
2012
2011
1999
© 2021 TechTarget, Inc.
Powered by
Badges | Report an Issue | Privacy Policy | Terms of Service
Most Popular Content on DSC
To not miss this type of content in the future, subscribe to our newsletter.
Other popular resources
Archives: 2008-2014 | 2015-2016 | 2017-2019 | Book 1 | Book 2 | More
Most popular articles