Sunaina has not received any gifts yet
Posted on March 7, 2018 at 3:30pm 0 Comments 0 Likes
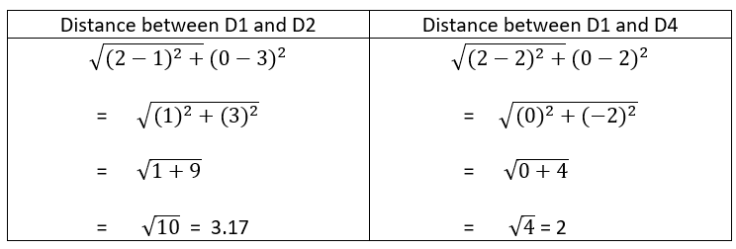
In this blog I will go a bit more in detail about the K-means method and explain how we can calculate the distance between centroid and data points to form a cluster.
Consider the below data set which has the values of the data points on a particular graph.
Table 1:
We can randomly choose two initial points as the centroids and from there we can start calculating distance of each point.
For now we will consider that D2 and D4 are…
ContinuePosted on March 7, 2018 at 1:30pm 2 Comments 0 Likes
Here, I've used the famous Iris Flower dataset to show the clustering in Power BI using R. I've used the K-means clustering method to show the different species of Iris flower.
About the dataset: The Iris dataset has 5 attributes (Sepal length, Sepal width, Petal width, Petal length, Species). The 3 different species are named as Setosa,…
Continue
© 2019 Data Science Central ®
Powered by
Badges | Report an Issue | Privacy Policy | Terms of Service