
Some foundations of statistical science have been questioned recently, especially the use and abuse of p-values. See also this article published in FiveThirtyEight.com. Statistical tests of hypotheses rely on p-values and other mysterious parameters and concepts that only the initiated can understand: power, type I error, type II error, or UMP tests, just to name a few. Pretty much all of us have had to learn this old stuff (pre-dating the existence of computers) in some college classes.
Sometimes results from a statistical test will be published in a mainstream journal – for instance about whether or not global warming is accelerating – using the same jargon that few understand, and accompanied by misinterpretations and flaws in the use of the test itself. Especially when tests are repeated over and over (or data adulterated or wrongly collected to start with) until they deliver the answer that we want.
While statistical tests of hypotheses will continue to be used in some circles for a long time (medical research for instance) due to a long tradition and maybe compliance with regulations (clinical trials) that kill innovation, I propose here a different solution that eliminates most of the drawbacks, and is especially suited for black-box or automated testing, where decisions are not taken, not even checked by human beings. An example is automated A/B testing, where tests are run daily to optimize conversions on a website, or in automated piloting. My solution – not something new indeed – does not come with statistical distributions, and is easy to compute, even SQL-friendly and Excel-friendly. No need to know math, not even basic probabilities, not even random variables, to understand how it works. You only need to understand percentages.
This methodology is robust by design. It is part of a data science framework (see section 2 in this article), in which many statistical procedures have been revisited to make them simple, scalable, accurate enough without aiming for perfection but instead for speed, and usable by engineers, machine learning practitioners, computer scientists, software engineers, AI and IoT experts, big data practitioners, business analysts, lawyers, doctors, journalists, even in some cases by the layman, and even by machines and API’s (as in machine-to-machine communications).
1. Statistical tests of hypotheses revisited
It works better with big and medium-size data than with small data, as it assumes that the data can be binned in a number (at least 100) of random bins, each with enough observations. It works as follows:
Step #1 – Compute a Confidence Interval (CI)
For the parameter you are interested in (say the mean value), compute a confidence interval of desired level (say 95%) using my elementary data-driven, model-free confidence intervals (you will even find an implementation in Excel when clicking on the link) that relies mostly on sorting and percentiles.
Step #2 – Is your tested value inside or outside the CI?
Let me illustrate this with a simple example. You want to see if the average temperature in Seattle, for years 2011-2015, is above the average for the years 2006-2010, in a way that is statistically significant. The mean temperature computed during 2006-2010 is (say) 51.95°F. The mean temperature computed during 2011-2015 is (say) 52.27°F. The 95% confidence interval (CI) for 2006-2010 is (say) [51.80°F, 52.20°F]. Now since 52.27°F is outside the CI, indeed above the upper bound 52.20°F, you can say there is a 2.5% chance (the whole CI covering 95% of the possibilities) that this high 52.27°F measurement occurred just by chance. In short, it is unlikely to have occurred by chance, thus the temperature increase is likely real. It is not very statistically significant though; it would have been if the CI that you computed had a 99.9% level, rather than 95% – but this requires collecting more data – maybe more than what is available.
Remarks
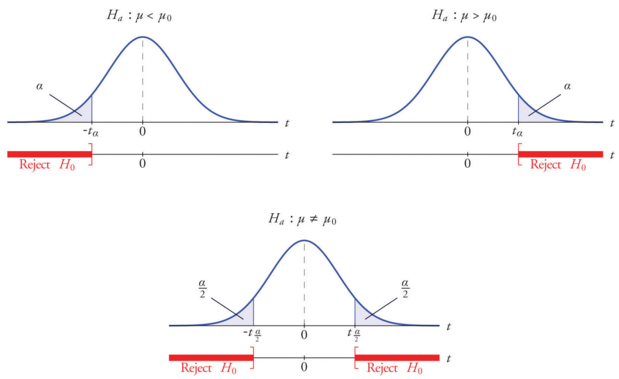
This CI concept is very simple: I did not even have to introduce the concept of one-sided versus two-sided tests. It is something you can easily explain to your boss or to a client.
Evidently, there are better ways to assess if the temperatures are rising. Time series analysis to detect trend after eliminating periodicity or unusual events (El Nino), if done properly, is the solution. This made-up example was provided for illustration purposes only. It also assumes that you have hundreds of data points: calibrated measurements from various weather stations at various times, that are somewhat consistent over time and locales.
Even if you want to stick with a test of hypotheses, a better solution is to compute temperatures differences (called temperature delta’s) observed at all locations, 2006-2010 versus 2011-2015, and use a CI for the delta’s. You would then check out whether the value 0 falls in your CI for delta. If yes,the difference in temperatures might be explained by luck; if no, probably there is a real change between the two time periods. By proceeding this way, you take into account local temperature variations not only for the 2006-2010 time period, but also for 2006-2010.
Finally, you can use this methodology to run a traditional test of hypotheses: it will yield very similar results. But there’s no math in it besides simple high school algebra. And this brings an interesting idea: my methodology can be taught to high school students, to get them interested in data science, without any pain.
Determining the optimum CI level
Typically the level of the underlying CI (95% in the above example) is decided beforehand. However, if the tests are part of a process to optimize some yield metrics, for instance when optimizing conversions on websites day after day, you can choose the level, within a specific range, say 65% to 99.9% – that produces the best performance. This is done by splitting your data into multiple independent buckets, using a different level for each bucket, and choose which level works best overall, after following results for some time. The level itself could be one of your parameters in your A/B testing.
2. The new statistical framework
Over years, I have designed a new, unified statistical framework for big data, data science, machine learning, and related disciplines. The tests of hypotheses described above fit in this framework. So far, here are the components of this framework. In parenthesis, you will find the equivalent in traditional (Bayesian or not) statistical science. Some of these techniques may be included in an upcoming course on automated data science, or added to our data science apprenticeship (for self-learners).
- Model-Free Confidence Intervals (Confidence Intervals)
- Tests of Hypotheses (Test of Hypotheses)
- Hidden Decision Trees (Decision Trees. Logistic Regression)
- Jackknife Regression (Regression – all types, clustering of variables)
- Indexation (Clustering – big unstructured data)
- Fast Combinatorial Feature Selection (Variable reduction)
I have also written quite a bit on time series (detection of accidental high correlations in big data, change point detection, multiple periodicities), correlation and causation, clustering for big data, random numbers, simulation, ridge regression (approximate solutions) and synthetic metrics (new variances, bumpiness coefficient, robust correlation metric and robust R-squared non sensitive to outliers.) I also explained how to make video from data (using R), even sound files. My next related article will be Variance, Clustering, and Density Estimation Revisited.
All of this will be available in my upcoming book data science 2.0.
Conclusion
A book such as Handbook of Parametric and Non Parametric Statistical procedures lists dozens of statistical tests of hypotheses. Likewise, dozens of regression techniques are available. Which one to choose? It is as if statistical science has become a field with a bunch of scattered methods, just like accounting that has hundreds of rules yet most of them won’t save you much money: they are designed to preserve job security for the practitioners. Even the expert gets sometimes confused, and this artificial complexity easily leads to abuse and misuse.
As a former statistician, confronted with this issue – working mostly with business people and on big data – I decided to simplify much of the theory, and make this field more united and approachable. Also, in designing this new framework, an important factor was to offer solutions that are easy to automate, understand, scale, and interpret. Including by the people who either use or pay for the statistical services.
About the author: Vincent Granville worked for Visa, eBay, Microsoft, Wells Fargo, NBC, a few startups and various organizations, to optimize business problems, boost ROI or to develop ROI attribution models, developing new techniques and systems to leverage modern big data and deliver added value. Vincent owns several patents, published in top scientific journals, raised VC funding, and founded a few startups. Vincent also manages his own self-funded research lab, focusing on simplifying, unifying, modernizing, automating, scaling, and dramatically optimizing statistical techniques. Vincent’s focus is on producing robust, automatable tools, API’s and algorithms that can be used and understood by the layman, and at the same time adapted to modern big, fast-flowing, unstructured data. Vincent is a post-graduate from Cambridge University.
Related article
DSC Resources
- Career: Training | Books | Cheat Sheet | Apprenticeship | Certification | Salary Surveys | Jobs
- Knowledge: Research | Competitions | Webinars | Our Book | Members Only | Search DSC
- Buzz: Business News | Announcements | Events | RSS Feeds
- Misc: Top Links | Code Snippets | External Resources | Best Blogs | Subscribe | For Bloggers
Additional Reading
- What statisticians think about data scientists
- Data Science Compared to 16 Analytic Disciplines
- 10 types of data scientists
- 91 job interview questions for data scientists
- 50 Questions to Test True Data Science Knowledge
- 24 Uses of Statistical Modeling
- 21 data science systems used by Amazon to operate its business
- Top 20 Big Data Experts to Follow (Includes Scoring Algorithm)
- 5 Data Science Leaders Share their Predictions for 2016 and Beyond
- 50 Articles about Hadoop and Related Topics
- 10 Modern Statistical Concepts Discovered by Data Scientists
- Top data science keywords on DSC
- 4 easy steps to becoming a data scientist
- 22 tips for better data science
- How to detect spurious correlations, and how to find the real ones
- 17 short tutorials all data scientists should read (and practice)
- High versus low-level data science
Follow us on Twitter: @DataScienceCtrl | @AnalyticBridge