
Guest blog by Kevin Gray.. Kevin is president of Cannon Gray, a marketing science and analytics consultancy.
Regression is arguably the workhorse of statistics. Despite its popularity, however, it may also be the most misunderstood. Why? The answer might surprise you: There is no such thing as Regression. Rather, there are a large number of statistical methods that are called Regression or grounded on its fundamental idea:
Dependent Variable = Constant + Slope*Independent Variable + Error
The Dependent Variable is something you want to predict or explain. In a Marketing Research context it might be Purchase Interest measured on a 0-10 rating scale. The Independent Variable is what you use to explain or predict the Dependent Variable. Continuing our consumer survey example, this could be a rating on an attribute such as Ease of Use using a 0-10 scale.
The Constant term in the equation above may be more familiar to you as the Y intercept; by convention, Y is used to represent the Dependent Variable and X the Independent Variable. Ring a bell? It should – you learned this in school. You’ll probably also remember that the Slope is amount Y changes when X changes by a certain amount.
The Error term is very important for many reasons, one being that it reminds us that we can seldom, if ever, predict Y from X exactly. When we can, it suggests that Y and X may be the same thing or that there is an error in our data! The pattern of errors is also a tip-off as to how trustworthy our model is and how to make it better.
This is an example of Simple Regression. When we have more than one Independent Variable – sometimes also called a Predictor or a Covariate – it becomes Multiple Regression. Multiple Regression is more widely used than Simple Regression in Marketing Research, Data Science and most fields because a single Independent Variable can usually only show us part of the picture.
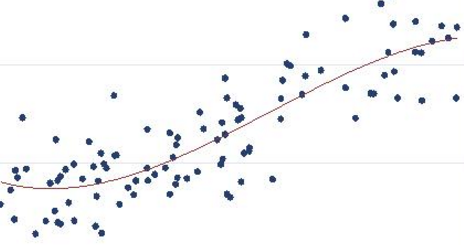
Related to this, many Marketing Researchers seem to be under the impression that Regression cannot deal with non-linear relationships or interactions. While the word “linear” is confusing and often used incorrectly, in short, the claim seems to be that Regression can only model straight-line relationships between the Y and the Xs. This is complete nonsense, and any introductory Regression class covers Polynomial Regression. Many Regression models, in fact, are linear only after transformations have been made!
Interactions are a complex topic but, essentially, describe moderation effects. For example, the relationship between age and Purchase Interest many depend on gender. Gender moderates the relationship between age and Purchase Interest. This is a commonplace example of an interaction. For various reasons, a modeler may prefer a simple model but nearly always has many options and choices to make. The righthand side of the equation – the part to the right of the equal sign – can take a lot of work to get right!
So Regression does exist after all! OK, I was being a tad glib earlier. At least, the fundamental idea exists, but there are many kinds of Regression we use depending on the questions we are trying to answer and the type of data we have. Even though the basic idea is very simple – drawing a line through an X-Y scatterplot in such a way that our errors are minimized – it gets complicated, and if someone were to tell you a million pages have been written about Regression, that surely would be an underestimate.
I cannot hope to get into any depth in this short post. I’ve already mentioned Simple and Multiple Regression. Some of you may remember ANOVA – Analysis of Variance – from a stats class or Marketing Research class. This is really a kind of regression in which the X variable or variables are categorical rather than numeric. Analysis of Covariance is used when there is at least one numeric (continuous or interval) variable mixed in with one or more categorical Independent Variables. To clarify what I mean, age is a numeric variable and age group and gender are categorical. Most Regressions have a blend of the two types on the righthand side.
Another crucial distinction is the type of Dependent Variable we’re working with. The subject of my Master’s thesis was predicting student loan default from loan application data. Though the definition of default depends on the loan agreement and various laws and regulations, eventually a student either repays their loan or does not. Default is a dichotomous, or binary variable, not a numeric one so using a form of Regression that assumes a numeric Dependent Variable would have been poor practice. Probit Regression was an option but I elected to use a slightly newer method known as Logistic Regression.
Sometimes our Dependent Variable is categorical but has more than two categories. In Choice Modeling (aka “Conjoint”), for example, respondents typically choose from three or more products in each choice task, and Multinomial Logistic Regression is used. It is based on the multinomial distribution, hence the name. It’s sometimes also called a Logit Model. In case you were wondering, there is also Multinomial Probit Regression. Probit models are based on the cumulative normal distribution and nearly always will give results that are very similar to Logistic Regression.
We may also have a categorical Dependent Variable in which the categories are ordered, such as heavy/medium/light user. Most 5 and 7 point rating scales popular in Marketing Research are ordinal scales, technically speaking, and Ordinal Logistic or Probit Regression will sometimes give different intepretations than our “standard” Regression, which assumes a numeric Dependent Variable.
Poisson and Negative Binomial Regression are two variations designed when your Dependent Variable is a count, for instance, how many times a customer bought a product or brand in the past year. Once again, using our familiar Regression can get us into trouble. Modeling count data is increasingly important in Data Mining and Predictive Analytics.
I’ve just scratched the surface. Besides the types of Regression I have never even heard of (!) there are Quantile Regression, Box-Cox Regression, Truncated and Censored Regression, Hurdle Regression, Nonparametric Regression as well as Regression methods for Time-Series and Longitudinal data. Structural Equation Modeling is a very large family of methods and in some ways may be seen as the most general (versatile) form of Regression. There is also Mixture Modeling, and I haven’t mentioned Artificial Neural Networks, Support Vector Machines or any of the many methods used in Data Mining and Predictive Analytics in addition to Regression, but do give a quick overview in Making Sense of Machine Learning.
How do you move beyond Stats 101? There are many courses, seminars and other materials online. I’m a big fan of textbooks and will mention a few here. Jeff Simonoff’s Analyzing Categorical Data and Alan Agresti’s Categorical Data Analysis are excellent ways to move to the next level. Frank Harrell’s Regression Modeling Strategies is more advanced but considered a bible by many practicing statisticians. I used Professor Harrell’s Logistic Regression program for my thesis.
Applied Logistic Regression (Hosmer and Lemeshow) and Modeling Count Data(Hilbe) are two other widely-cited books, as is Generalized Linear Models and Extensions (Hardin and Hilbe). Roger Koenker’s Quantile Regression is the authoritative source for that method. I also appreciated the author’s dry wit. Statistical Rethinking (McElreath) approaches many of these topics from a Bayesian point of view.
Paul Jose has written a very readable introduction to causal analysis entitled Statistical Mediation and Moderation. Rex Kline’s superb Principles and Practice of Structural Equation Modeling is a great way to get started on SEM. Time Series Analysis (Wei) is an excellent introduction to TSA and I loved Multilevel and Longitudinal Modeling (Rabe-Hesketh and Skrondal).
I’ve listed quite a few other sources in my company library.
We’ve come a long way in a pretty short space of time…My father worked in Pharmacology and Toxicology, and ANOVA and Probit Analysis were his stock-in-trade. I still have his copies of R.A. Fisher’s Statistical Methods for Research Workers and D. J. Finney’s Probit Analysis in my library. When he began his career computer science was in its infancy and he had to rely on a slide rule, a mechanical adding machine and Barlow’s Tables. What took Dad days I can now do in a matter of minutes. Besides having fast computers with a lot of memory, many software packages are very easy to use…which means they are also very easy to misuse.
Regression isn’t rocket science but it isn’t instant ramen either. Use it wisely and it will show you what lies beneath your cross tabs and dashboards. Use it carelessly and you may pay a hefty price.
Hope this has been interesting and helpful!
Top DSC Resources
- Article: Difference between Machine Learning, Data Science, AI, Deep Learnin…
- Article: What is Data Science? 24 Fundamental Articles Answering This Question
- Article: Hitchhiker’s Guide to Data Science, Machine Learning, R, Python
- Tutorial: Data Science Cheat Sheet
- Tutorial: How to Become a Data Scientist – On Your Own
- Tutorial: State-of-the-Art Machine Learning Automation with HDT
- Categories: Data Science – Machine Learning – AI – IoT – Deep Learning
- Tools: Hadoop – DataViZ – Python – R – SQL – Excel
- Techniques: Clustering – Regression – SVM – Neural Nets – Ensembles – Decision Trees
- Links: Cheat Sheets – Books – Events – Webinars – Tutorials – Training – News – Jobs
- Links: Announcements – Salary Surveys – Data Sets – Certification – RSS Feeds – About Us
- Newsletter: Sign-up – Past Editions – Members-Only Section – Content Search – For Bloggers
- DSC on: Ning – Twitter – LinkedIn – Facebook – GooglePlus
Follow us on Twitter: @DataScienceCtrl | @AnalyticBridge