
Logistic regression is typically used when the response Y is a probability or a binary value (0 or 1). For instance, the chance for an email message to be spam, based on a number of features such as suspicious keywords or IP address. In matrix notation, the model can be written as
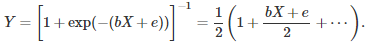
where X is the observations matrix, b is the parameter vector that needs to be estimated, and e is a white noise. The first order approximation around zero, in the above Taylor series expansion, yields
4Y – 2 = bX + e.
If instead of the logistic function, you use a different one, you would still get the same first-order approximation in general. Replacing 4Y – 2 by Z, we are left with a standard linear regression. When the response is binary (1 = spam, 0 = not spam), the technique can be further refined by introducing an extra parameter q called the threshold. The final estimate for a particular observation (an email with its set of attributes) is set to 1 (spam) if its Z value is larger than q, and to 0 (normal email) otherwise. By default, q = 0, but you could choose q to achieve the best classification of your training set (on the test set used in a cross-validation setting.) The correctness of the method can be measured for instance as a weighted proportion of false positives and false negatives.
The methodology can easily be extended to more than 2 classes, using multiple thresholds parameters and proper labeling (for instance: 3 for scam, 2 for spam, 1 for low priority email, 0 for normal email.) Even though the technique is not model-driven, confidence intervals can still be built using re-sampling techniques described here and here. In particular, it is possible to tell whether an email is very highly likely to be spam, or whether there is some non-conclusive evidence that it might be spam, based on the distance (its empirical distribution computed via re-sampling) between the observed Z and the threshold q.
It would be interesting to compare this method with a standard logistic regression, to see, using a confusion matrix, the differences (if any) in the way the messages are classified. More importantly, it would be useful to test when the approximated solution is not as good as the exact solution.
Other techniques to perform this type of clustering include neural networks, naive Bayes, and hybrid models (combining multiple techniques.)
To not miss this type of content in the future, subscribe to our newsletter. For related articles from the same author, click here or visit www.VincentGranville.com. Follow me on on LinkedIn, or visit my old web page here.