
Here is a simple trick that can solve a lot of problems.
You can not trust a linear or logistic regression performed on data if the error term (residuals) are auto-correlated. There are different approaches to de-correlate the observations, but they usually involve introducing a new matrix to take care of the resulting bias. See for instance here.
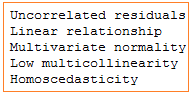
Requirements for linear regression
A radically different and much simpler approach is to re-shuffle the observations, randomly. If it does not take care of the issue (auto-correlations are weakened but still remain significant, after re-shuffling) it means that there is something fundamentally wrong about the data set, perhaps with the way the data was collected. In that case, cleaning the data or getting new data is the solution. But usually, re-shuffling – if done randomly – will eliminate these pesky correlations.
The trick
Reshuffling is done as follows:
- Add one column to your data set, consisting of pseudo random numbers, for instance generated with the function RAND in Excel.
- Sort the entire data set (all the columns, plus the new column containing the pseudo random numbers) according to the values in the newly added column.
Then do the regression again, and look at improvements in model performance. R-squared may not be a good indicator, but techniques based on cross-validation should be used instead.
Actually, any regression technique where the order of the observations does not matter, will not be sensitive to these auto-correlations. If you want to stick to standard, matrix-based regression techniques, then re-shuffling all your observations 10 times (to generate 10 new data sets, each one with the same observations but ordered in a different way) is the solution. Then you will end up with 10 different sets of estimates and predictors: one for each data set. You can compare them; if they differ significantly, there is something wrong in your data, unless auto-correlations are expected, as in time series models (in that case, you might want to use different techniques anyway, for instance techniques adapted to time series, see here.).
Testing for auto-correlations in the observations
If you have n observations and p variables, there is no global auto-correlation coefficient that measures the association between one observation and the next one. One way to do it is to compute it for each variable (column) separately. This will give you p lag-1 auto-correlation coefficients. Then you can look at the minimum (is it high in absolute value?) or the maximum (in absolute value) among these p coefficients. You can also check lag-2, lag-3 auto-correlations and so on. While auto-correlation between observations is not the same as auto-correlation between residuals, they are linked, and it is still a useful indicator of the quality of your data. For instance, if the data comes from sampling and consists of successive blocks of observations, each block corresponding to a segment, then you are likely to find auto-correlations, both in the observations and the residuals. Or if there is a data glitch and some observations are duplicated, you can experience the same issue.
To not miss this type of content in the future, subscribe to our newsletter. For related articles from the same author, click here or visit www.VincentGranville.com. Follow me on on LinkedIn, or visit my old web page here.