
Here I discuss my prediction about the worst 15-year long (yet unabated) real estate bubble: this is an example where visualizations, when not carefully selected and put into context, can be seriously misleading, even for top experts. Here I also provide some hints to help you avoid these visualization traps. This article shows how data scientists should think, when confronted to charts such as the one below.
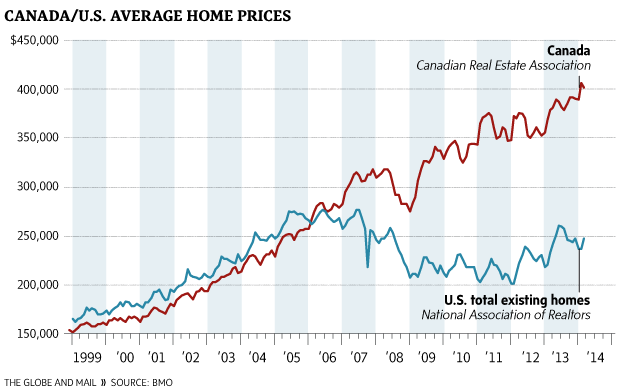
Looking at this chart, you would think that the Canadian real estate market is on the brink of collapse — such a long stretch of strong growth is much overdue for a collapse, right? However, I don’t think it will happen soon (not in the next 5 years.) Before you read further, think about why I might or might not be wrong about my prediction.
Why is this picture misleading?
It is misleading in the sense that the Canadian market is 10 times smaller than the US market, and this is not reflected in the above chart. Thus, compared to the 2007 real estate bubble in US, this is a tiny bubble with plenty of room to grow. Comparing the US and Canadian markets amounts to comparing a startup with Google. Then there are factors that can explain the continuous growth: commodities such as oil (Canada is a big producer with lots of potential though prices are down now,) global warming driving people North, and the fact that wealthy people from China and other countries are buying in places such as Vancouver (the most expensive city for real estate in North America – worst than New York City or San Francisco) to protect their assets from their governments.
Also, my rule of thumb is that any bubble, from start to finish, can grow by a factor 3 in just a few (say 5) years. Local bubbles such as San Francisco or Vancouver are getting closer to that limit, but again they are very local and thus small, in terms of total dollars involved.
What about Seattle?
Vancouver is about 140 miles North of Seattle, and San Francisco less than two hours South, by plane. Both cities are twice as expensive as Seattle, regarding real estate. And Vancouver does not have high-paying jobs for people like us (have you ever seen a job ad for a data scientist in Vancouver?) How can this be explained?
My guess is that Seattle is slowly catching up, Smart arbitragers are more and more going to buy in an under-priced market: that would be my bet.
DSC Resources
- Career: Training | Books | Cheat Sheet | Apprenticeship | Certification | Salary Surveys | Jobs
- Knowledge: Research | Competitions | Webinars | Our Book | Members Only | Search DSC
- Buzz: Business News | Announcements | Events | RSS Feeds
- Misc: Top Links | Code Snippets | External Resources | Best Blogs | Subscribe | For Bloggers
Additional Reading
- What statisticians think about data scientists
- Data Science Compared to 16 Analytic Disciplines
- 10 types of data scientists
- 91 job interview questions for data scientists
- 50 Questions to Test True Data Science Knowledge
- 24 Uses of Statistical Modeling
- 21 data science systems used by Amazon to operate its business
- Top 20 Big Data Experts to Follow (Includes Scoring Algorithm)
- 5 Data Science Leaders Share their Predictions for 2016 and Beyond
- 50 Articles about Hadoop and Related Topics
- 10 Modern Statistical Concepts Discovered by Data Scientists
- Top data science keywords on DSC
- 4 easy steps to becoming a data scientist
- 22 tips for better data science
- How to detect spurious correlations, and how to find the real ones
- 17 short tutorials all data scientists should read (and practice)
- High versus low-level data science
Follow us on Twitter: @DataScienceCtrl | @AnalyticBridge