
A new JavaScript library, called GWIS (Graphing Water Information System), can create time-series plots of information measured at U.S. Geological Survey hydrologic data collection sites across the United States.
Developed by the USGS Texas Water Science Center, the user-friendly interface integrates the open-source dygraphs JavaScript charting library with hydrologic data provided by USGS water services.
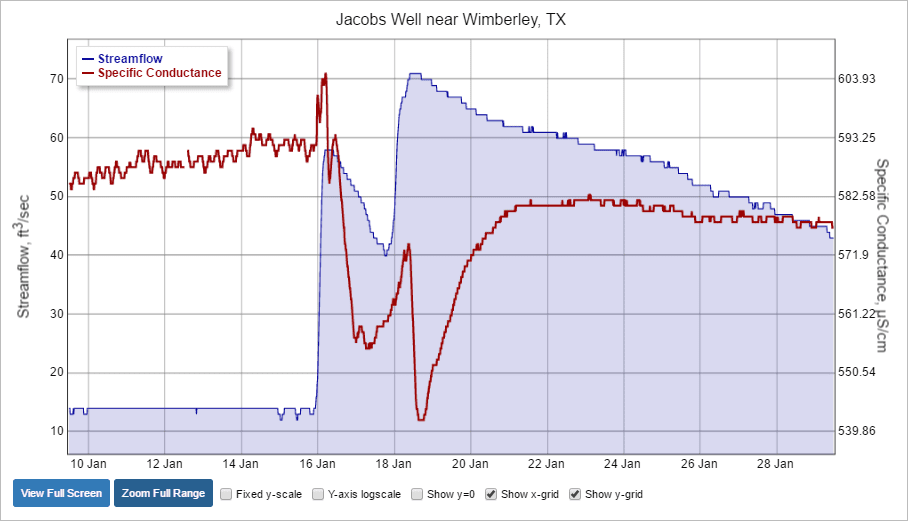
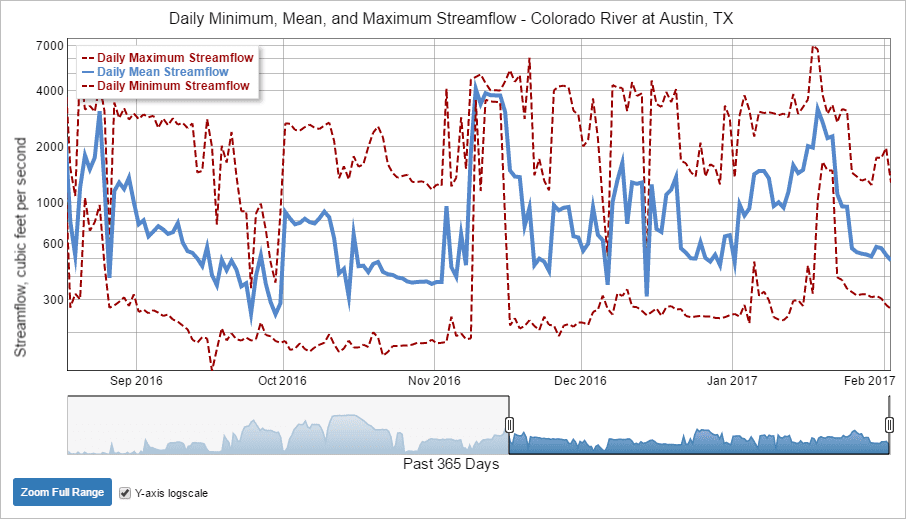
Using GWIS, one or more interactive plots of any current or historical data available from the USGS Instantaneous (Real-Time) Service or Daily Value Service can easily be inserted into a web page. Plot appearance is customizable, and the plots feature interactive zooming, an interactive legend and optional user controls such as full screen and y-axis log scaling. Multiple plot series, double y-axes and pop-up plots are also supported.
Some GWIS plot features available with the library include:
- Interactive Zoom: Click-drag vertically or horizontally in the axes to zoom the plot. Double clicking resets the full range.
- Interactive Legend: Hover over the axes to display values for each series in the legend.
- Custom Controls: Several tools are available that can be added below the plot.
- Multiple Data Series Support: Add many data series to your plot.
- Double Y-Axis Support: Show relationships between data with different units using double y-axes.
- Customizable Appearance: Style the plot using a variety of options.
Visit the GWIS homepage (https://txpub.usgs.gov/dss/gwis/) to get started. The web page contains several samples, documentation and access to the source code.
Originally posted here.
Top DSC Resources
- Article: Difference between Machine Learning, Data Science, AI, Deep Learnin…
- Article: What is Data Science? 24 Fundamental Articles Answering This Question
- Article: Hitchhiker’s Guide to Data Science, Machine Learning, R, Python
- Tutorial: Data Science Cheat Sheet
- Tutorial: How to Become a Data Scientist – On Your Own
- Categories: Data Science – Machine Learning – AI – IoT – Deep Learning
- Tools: Hadoop – DataViZ – Python – R – SQL – Excel
- Techniques: Clustering – Regression – SVM – Neural Nets – Ensembles – Decision Trees
- Links: Cheat Sheets – Books – Events – Webinars – Tutorials – Training – News – Jobs
- Links: Announcements – Salary Surveys – Data Sets – Certification – RSS Feeds – About Us
- Newsletter: Sign-up – Past Editions – Members-Only Section – Content Search – For Bloggers
- DSC on: Ning – Twitter – LinkedIn – Facebook – GooglePlus
Follow us on Twitter: @DataScienceCtrl | @AnalyticBridge