
Guest blog post by Martijn Theuwissen, co-founder at DataCamp. Other R resources can be found here, and R Source code for various problems can be found here. A data science cheat sheet can be found here, to get you started with many aspects of data science, including R.
Learning R can be tricky, especially if you have no programming experience or are more familiar working with point-and-click statistical software versus a real programming language. This learning path is mainly for novice R users that are just getting started but it will also cover some of the latest changes in the language that might appeal to more advanced R users.
Creating this learning path was a continuous trade-off between being pragmatic and exhaustive. There are many excellent (free) resources on R out there, and unfortunately not all could be covered here. The material presented here is a mix of relevant documentation, online courses, books, and more that we believe is best to get you up to speed with R as fast as possible.
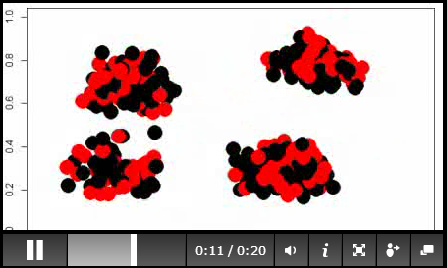
Data Video produced with R: click here and also here for source code and to watch the video. More here.
Here is an outline:
- Step 0: Why you should learn R
- Step 1: The Set-Up
- Step 2: Understanding the R Syntax
- Step 3: The core of R -> packages
- Step 4: Help?!
- Step 5: The Data Analysis Workflow
- 5.1 Importing Data
- 5.2 Data Manipulation
- 5.3 Data Visualization
- 5.4 The stats part
- 5.5 Reporting your results
- Step 6: Become an R wizard and discovering exciting new stuff
Step 0: Why you should learn R
R is rapidly becoming the lingua franca of Data Science. Having its origins in academics, you will spot it today in an increasing number of business settings as well where it is a contestant to commercial software incumbents such as SAS, STATA and SPSS. Each year, R gains in popularity and in 2015 IEEE listed R in the top ten languages of 2015.
This implies that the demand for individuals with R knowledge is growing, and consequently learning R is definitely a smart investment career wise (according to this survey R even is the highest paying skill). This growth is unlikely to plateau in the next years with large players such as Oracle &Microsoft stepping up by including R in its offerings.
Nevertheless, money should not be the only driver when deciding to learn a new technology or programming language. Luckily, R has a lot more to offer than a solid paycheck. By engaging yourself with R, you will become familiar with a highly diverse and interesting community. Namely, R is being used for a diverse set of task such as finance, genomic analysis, real estate, paid advertising, and much more. All these fields are actively contributing to the development of R. You will encounter a diverse set of examples and applications on a daily basis, keeping things interesting and giving you the ability to apply your knowledge on a diverse range of problems.
Have fun!
Step 1: The Set-Up
Before you can actually start working in R, you need to download a copy of it on your local computer. R is continuously evolving and different versions have been released since R was born in 1993 with (funny) names such as World-Famous Astronaut and Wooden Christmas-Tree. Installing R is pretty straightforward and there are binaries available for Linux, Mac and Windows from the Comprehensive R Archive Network (CRAN).
Once R is installed, you should consider installing one of R’s integrated development environment as well (although you could also work with the basic R console if you prefer). Two fairly established IDE’s are RStudio and Architect. In case you prefer a graphical user interface, you should check out R-commander.
Step 2: Understanding the R Syntax
Learning the syntax of a programming language like R is very similar to the way you would learn a natural language like French or Spanish: by practice & by doing. One of the best ways to learn R by doing is through the following (online) tutorials:
- DataCamp’s free introduction to R tutorial and the follow-up course Intermediate R programming. These courses teach you R programming and data science interactively, at your own pace, in the comfort of your browser.
- The swirl package, a package with offline interactive R coding exercises. There is also an online version available that requires no set-up.
- On edX you can take Introduction to R Programming by Microsoft.
- The R Programming course by Johns Hopkins on Coursera.
Next to these online tutorials there are also some very good introductory books and written tutorials to get you started:
- Jared Lander’s R for Everyone
- R in Action by Robert Kabacoff
- The free introduction to R manual by CRAN
Step 3: The core of R -> packages
Every R package is simply a bundle of code that serves a specific purpose and is designed to be reusable by other developers. In addition to the primary codebase, packages often include data, documentation, and tests. As an R user, you can simply download a particular package (some are even pre-installed) and start using its functionalities. Everyone can develop R packages, and everyone can share their R packages with others.
The above is an extremely powerful concept and one of the key reasons R is so successful as a language and as a community. Namely, you don’t need to do all the hard core programming yourself or understand every complex detail of a particular algorithm or visualization. You can simple use the out-of-the box functions that come with the relevant package as an interface to such functionalities. As such it is useful to have an understanding of R’s package ecosystem.
Many R packages are available from the Comprehensive R Archive Network, and you can install them using the install.packages function. What is great about CRAN is that it associates packages with a particular task via Task Views. Alternatively, you can find R packages on bioconductor, github and bitbucket.
Looking for a particular package and corresponding documentation? Try Rdocumentation, where you can easily search packages from CRAN, github and bioconductor.
Step 4: Help?!
You will quickly find out that for every R question you solve, five new ones will pop-up. Luckily, there are many ways to get help:
- Within R you can make use of its built-in help system. For example the command `?plot` will provide you with the documentation on the plot function.
- R puts a big emphasis on documentation. The previously mentionedRdocumentation is a great website to look at the different documentation of different packages and functions.
- Stack Overflow is a great resource for seeking answers on common R questions or to ask questions yourself.
- There are numerous blogs & posts on the web covering R such asKDnuggets and R-bloggers.
Step 5: The Data Analysis Workflow
Once you have an understanding of R’s syntax, the package ecosystem, and how to get help, it’s time to focus on how R can be useful for the most common tasks in the data analysis workflow
5.1 Importing Data
Before you can start performing analysis, you first need to get your data into R. The good thing is that you can import into R all sorts of data formats, the hard part this is that different types often need a different approach:
- Flat files: You can import flat files with functions such as read.table() and read.csv() from the pre-installed utils package. Specific R packages to import flat files data are readr and fread() function of the data.table package.
- You can get your excel files into R with either the readxl package, the gdata package and XLConnect package. (Read more on importing your excel files into R)
- The haven package lets you import SAS, STATA and SPSS data files into R. The foreign package lets you import formats like Systat and Weka.
- Connecting with a database happens via specific packages like RMySQL, RpostgreSQL and the ROracle package. Accessing and manipulating the database happens via DBI.
- For web scraping you can use a package like rvest. (For more info on web scraping with R check the blog of Rolf Fredheim.)
If you want to learn more on how to import data into R check an online Importing Data into R tutorial or this post on data importing.
5.2 Data Manipulation
Performing data manipulation with R is a broad topic as you can see in for example this Data Wrangling with R video by RStudio or the book Data Manipulation with R. This is a list of packages in R that you should master when performing data manipulations:
- The tidyr package for tidying your data.
- The stringr package for string manipulation.
- When working with data frame like objects it is best to make yourself familiar with the dplyr package (try this course). However. in case of heavy data wrangling tasks, it makes more sense to check out the blazingly fast data.table package (see this syntax cheatsheet for help).
- When working with times and dates install the lubridate package which makes it a bit easier to work with these.
- Packages like zoo, xts and quantmod offer great support for time series analysis in R.
5.3 Data Visualization
One of the main reasons R is the favorite tool of data analysts and scientists is because of its data visualization capabilities. Tons of beautiful plots are created with R as shown by all the posts on FlowingData, such as this famous facebook visualization.
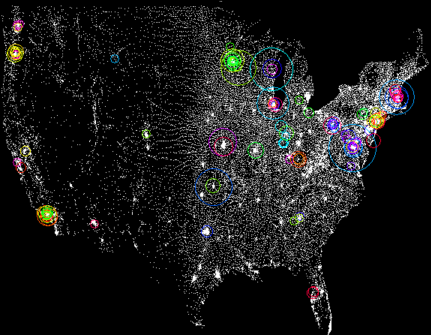
Credit card fraud scheme featuring time, location, and loss per event, using R: click here for source
If you want to get started with visualizations in R, take some time to study theggplot2 package. One of the (if not the) most famous packages in R for creating graphs and plots. ggplot2 is makes intensive use of the grammar of graphics, and as a result is very intuitive in usage (you’re continuously building part of your graphs so it’s a bit like playing with lego). There are tons of resources to get your started such as this interactive coding tutorial, a cheatsheet and an upcoming book by Hadley Wickham.
Besides ggplot2 there are multiple other packages that allow you to create highly engaging graphics and that have good learning resources to get you up to speed. Some of our favourites are:
- ggvis for interactive web graphics (see tutorial )
- googleVis to interface with google charts
- Plotly for R
If you want to see more packages for visualizations see the CRAN task view. In case you run into issues plotting your data this post might help as well.
Next to the “traditional” graphs, R is able to handle and visualize spatial data as well. You can easily visualize spatial data and models on top of static maps from sources such as Google Maps and Open Street Maps with a package such as ggmap. Another great package is choroplethr developed by Ari Lamstein of Trulia or the tmap package. Take this tutorial onIntroduction to visualising spatial data in R if you want to learn more.
5.4 The stats part
In case you are new to statistics, there are some very solid sources that explain the basic concepts while making use of R:
- Andrew Conway’s Introduction to statistics with R (online interactive coding course)
- Data Analysis and Statistical Inference by Duke University (MOOC)
- Practical Data Science With R (book)
- Data Analysis for life sciences by Harvard University (MOOC)
- Data Science Specialization by Johns Hopkins (MOOC)
- A Survival Guide to Data Science with R (book)
Note that these resources are aimed at beginners. If you want to go more advanced you can look at the multiple resources there are for machine learning with R. Books such as Mastering Machine Learning with R andMachine Learning with R explain the different concepts very well, and online resources like the Kaggle Machine Learning course help you practice the different concepts. Furthermore there are some very interesting blogs to kickstart your ML knowledge like Machine Learning Mastery or this post.
5.5 Reporting your results
One of the best way to share your models, visualizations, etc is through dynamic documents. R Markdown (based on knitr and pandoc) is a great tool for reporting your data analysis in a reproducible manner though html, word, pdf, ioslides, etc. This 4 hour tutorial on Reporting with R Markdownexplains the basics of R markdown. Once you are creating your own markdown documents, make sure this cheat sheet is on your desk.
Step 6: Become an R wizard and discovering exciting new stuff
R is a fast-evolving language. It’s adoption in academics and business is skyrocketing, and consequently the rate of new features and tools within R is rapidly increasing. These are some of the new technologies and packages that excite us the most:
- HTML widgets allow you to create interactive web visualizations such as dynamic maps (leaflet), time-series data charting (dygraphs), and interactive tables (DataTables). If you want to learn how to create your own watch this tutorial by RStudio.
- Another technology making a lot of noise recently is Shiny. With Shiny you can make your own interactive web applications in R such as these. There is a whole learning portal dedicated to building your own Shiny applications.
- Lately, there is a lot of focus on how to run R in the cloud. If you want to do this yourself, you can have a look at tutorials such as running R on AWS, the R programming language for Azure, and RStudio Server on Digital Ocean.
Once you have some experience with R, a great way to level up your R skillset is the free book Advanced R by Hadley Wickham. In addition, you can start practicing your R skills by competing with fellow Data Science Enthusiasts on Kaggle, an online platform for data-mining and predictive modelling competitions. Here you have the opportunity to work on fun cases such as this titanic data set.
To end, you are now probably ready to start contributing to R yourself by writing your own packages. Enjoy!
DSC Resources
- Career: Training | Books | Cheat Sheet | Apprenticeship | Certification | Salary Surveys | Jobs
- Knowledge: Research | Competitions | Webinars | Our Book | Members Only | Search DSC
- Buzz: Business News | Announcements | Events | RSS Feeds
- Misc: Top Links | Code Snippets | External Resources | Best Blogs | Subscribe | For Bloggers
Additional Reading
- What statisticians think about data scientists
- Data Science Compared to 16 Analytic Disciplines
- 10 types of data scientists
- 91 job interview questions for data scientists
- 50 Questions to Test True Data Science Knowledge
- 24 Uses of Statistical Modeling
- 21 data science systems used by Amazon to operate its business
- Top 20 Big Data Experts to Follow (Includes Scoring Algorithm)
- 5 Data Science Leaders Share their Predictions for 2016 and Beyond
- 50 Articles about Hadoop and Related Topics
- 10 Modern Statistical Concepts Discovered by Data Scientists
- Top data science keywords on DSC
- 4 easy steps to becoming a data scientist
- 22 tips for better data science
- How to detect spurious correlations, and how to find the real ones
- 17 short tutorials all data scientists should read (and practice)
- High versus low-level data science
Follow us on Twitter: @DataScienceCtrl | @AnalyticBridge