
Feature selection is one of the core topics in machine learning. In statistical science, it is called variable reduction or selection. Our scientist published a methodology to automate this process and efficiently handle la large number of features (called variables by statisticians). Click here for details.
Here, we mention an article published by Isabelle Guyon and Andre Elisseeff in Journal of Machine Learning Research. While published in 2003, it is still one of the best ML papers on feature selection.
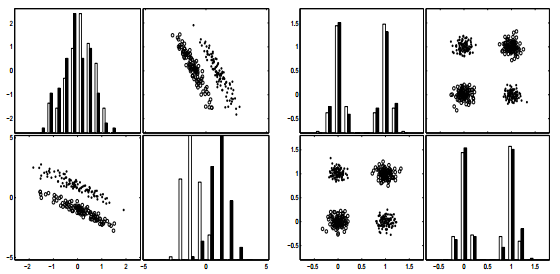
Figure 3 from the article: A variable useless by itself can be useful together with others
Abstract
Variable and feature selection have become the focus of much research in areas of application for
which datasets with tens or hundreds of thousands of variables are available. These areas include
text processing of internet documents, gene expression array analysis, and combinatorial chemistry.
The objective of variable selection is three-fold: improving the prediction performance of the predictors,
providing faster and more cost-effective predictors, and providing a better understanding of
the underlying process that generated the data. The contributions of this special issue cover a wide
range of aspects of such problems: providing a better definition of the objective function, feature
construction, feature ranking, multivariate feature selection, efficient search methods, and feature
validity assessment methods.
Conclusion
The recent developments in variable and feature selection have addressed the problem from the pragmatic point of view of improving the performance of predictors. They have met the challenge of operating on input spaces of several thousand variables. Sophisticated wrapper or embedded methods improve predictor performance compared to simpler variable ranking methods like correlation methods, but the improvements are not always significant: domains with large numbers of input variables suffer from the curse of dimensionality and multivariate methods may overfit the data. For some domains, applying first a method of automatic feature construction yields improved performance and a more compact set of features. The methods proposed in this special issue have been tested on a wide variety of data sets (see Table 1), which limits the possibility of making comparisons across papers. Further work includes the organization of a benchmark. The approaches are very diverse and motivated by various theoretical arguments, but a unifying theoretical framework is lacking. Because of these shortcomings, it is important when starting with a new problem to have a few baseline performance values. To that end, we recommend using a linear predictor of your choice (e.g. a linear SVM) and select variables in two alternate ways: (1) with a variable ranking method using a correlation coefficient or mutual information; (2) with a nested subset selection method performing forward or backward selection or with multiplicative updates. Further down the road, connections need to be made between the problems of variable and feature selection and those of experimental design and active learning, in an effort to move away from observational data toward experimental data, and to address problems of causality inference
Below is a screenshot from the article:
The 10 questions below is an extract from this long article:
- Do you have domain knowledge? If yes, construct a better set of “ad hoc” features.
- Are your features commensurate? If no, consider normalizing them.
- Do you suspect interdependence of features? If yes, expand your feature set by constructing conjunctive features or products of features, as much as your computer resources allow you (see example of use in Section 4.4).
- Do you need to prune the input variables (e.g. for cost, speed or data understanding reasons)? If no, construct disjunctive features or weighted sums of features (e.g. by clustering or matrix factorization, see Section 5).
- Do you need to assess features individually (e.g. to understand their influence on the system or because their number is so large that you need to do a first filtering)? If yes, use a variable ranking method (Section 2 and Section 7.2); else, do it anyway to get baseline results.
- Do you need a predictor? If no, stop.
- Do you suspect your data is “dirty” (has a few meaningless input patterns and/or noisy outputs or wrong class labels)? If yes, detect the outlier examples using the top ranking variables obtained in step 5 as representation; check and/or discard them.
- Do you know what to try first? If no, use a linear predictor.3 Use a forward selection method (Section 4.2) with the “probe” method as a stopping criterion (Section 6) or use the `0-norm embedded method (Section 4.3). For comparison, following the ranking of step 5, construct a sequence of predictors of same nature using increasing subsets of features. Can you match or improve performance with a smaller subset? If yes, try a non-linear predictor with that subset.
- Do you have new ideas, time, computational resources, and enough examples? If yes, compare several feature selection methods, including your new idea, correlation coefficients, backward selection and embedded methods (Section 4). Use linear and non-linear predictors. Select the best approach with model selection (Section 6).
- Do you want a stable solution (to improve performance and/or understanding)? If yes, subsample your data and redo your analysis for several “bootstraps” (Section 7.1).
Click here to read the full article (PDF).
DSC Resources
- Career: Training | Books | Cheat Sheet | Apprenticeship | Certification | Salary Surveys | Jobs
- Knowledge: Research | Competitions | Webinars | Our Book | Members Only | Search DSC
- Buzz: Business News | Announcements | Events | RSS Feeds
- Misc: Top Links | Code Snippets | External Resources | Best Blogs | Subscribe | For Bloggers
Additional Reading
- What statisticians think about data scientists
- Data Science Compared to 16 Analytic Disciplines
- 10 types of data scientists
- 91 job interview questions for data scientists
- 50 Questions to Test True Data Science Knowledge
- 24 Uses of Statistical Modeling
- 21 data science systems used by Amazon to operate its business
- Top 20 Big Data Experts to Follow (Includes Scoring Algorithm)
- 5 Data Science Leaders Share their Predictions for 2016 and Beyond
- 50 Articles about Hadoop and Related Topics
- 10 Modern Statistical Concepts Discovered by Data Scientists
- Top data science keywords on DSC
- 4 easy steps to becoming a data scientist
- 22 tips for better data science
- How to detect spurious correlations, and how to find the real ones
- 17 short tutorials all data scientists should read (and practice)
- High versus low-level data science
Follow us on Twitter: @DataScienceCtrl | @AnalyticBridge