

What’s the value of my data?
Today’s most critical question to which every organization should know the answer still goes unanswered in an age where the world’s most valuable resource is data.
I’m going to detail my approach to how I help my clients determine the value of their data. Here are some important theorems that underpin my approach:
- One cannot determine the value of one’s data in isolation from the business
- The value of one’s data is attributed to its ability to improve, increase, reduce, optimize, or rationalize the organization’s key business and operational use cases.
- Organizations don’t fail due to a lack of use cases; they fail because they have too many.
- An incremental use-case-by-use-case approach greatly simplifies the data valuation determination and unleashes the economic value of one’s data and analytics.
I laid out this data valuation approach in “Building Value-driven Data Strategy: Use Case Approach – Part 2,” but I want to clarify further with an example in this blog. So please do your homework and review that blog before diving into this blog. Thanks!
High-tech Manufacturer Scenario
In this blog, I will create a scenario for a high-tech manufacturer dependent upon a network of suppliers and contract manufacturers to build many of the components and subassemblies that comprise their sophisticated technology product. This manufacturer has annual revenues in the $40B to $75B range and sells Business-to-Business.
In this scenario, this high-tech manufacturer already hired me (always a questionable move) to lead their organization through education, envisioning, and prioritization process (3-to-4-month engagement) to identify, validate, value, and prioritize their business and operational use cases around the following strategic business initiative:
Reduce inventory costs and components out-of-stock while improving supply chain and logistics predictability and quality.
Out of the envisioning workshop, we prioritized these three use cases:
- Use Case #1: Improve Vendor Quality by 5%
- Use Case #2: Improve Vendor Reliability by 5%
- Use Case #3: Reducing component inventory costs by 5%
Let’s dive into the data and analytics value attribution process for each use case. This might get a bit tedious, but this probably be the best way to explain how the process works.
Use Case #1 Data Value Determination
Use Case #1 seeks to Improve Vendor Quality by 5%, yielding $60M in annual savings by reducing customer product returns, reducing field service calls, reducing product reworks in the field, and improving customer referrals, Net Promote Scores (NPS), and Likelihood to Recommend (LTR).
The data science team, using the “Thinking Like a Data Scientist” process, determines that Use Case #1 requires 3 data sets (Customer Orders, Vendor Shipments, and Customer Product Returns) and two analytic modules (Anomaly Detection and Vendor Quality Score). See Figure 1.
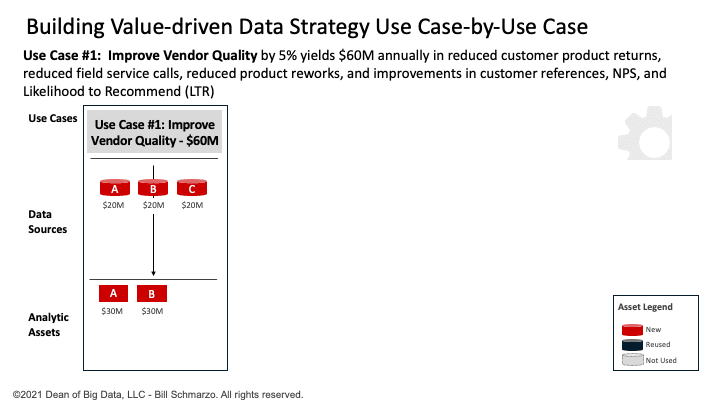
Figure 1: Use Case #1: Improve Vendor Quality
Note: Determining the $60M in potential savings is an exercise that any financial analyst could complete. No need to try to turn data scientists into financial analysts.
I’ve used a straight-line data valuation attribution model so that if the use case is worth $60M. There are 3 data sets and two analytic modules necessary to optimize that use case, then each data set gets one-third of the attributable value (1 ÷ 3 × $60M = $20M). Each of the two analytic modules gets one-half of the attributable value (1 ÷ 2 × $60M = $30M). See Figure 2.
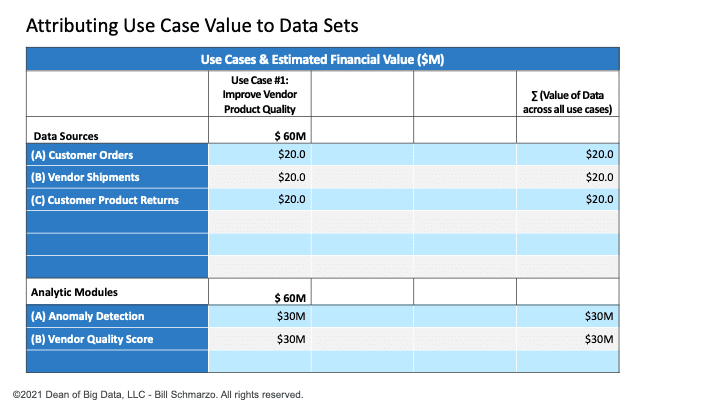
Figure 2: Value Attribution After Use Case #1
Note: One could get a more granular data valuation attribution model using Principal Component Analysis and Shapley Additive Explanations. But that’s overkill for this exercise.
Use Case #2 Data Value Determination
Use Case #2 seeks to Improve Vendor Reliability by 5%, yielding $20M in annual savings through reduced component out-of-stocks, reduced rush orders, reduced vendor recommissions, and improvements in customer referrals, Net Promoter Scores, and Likelihood to Recommend.
The data science team has determined that Use Case #2 requires 2 data sets (reusing Customer Orders and adding Expedited Orders) and 2 analytic modules (reusing Anomaly Detection and adding Vendor Reliability Score). See Figure 3.
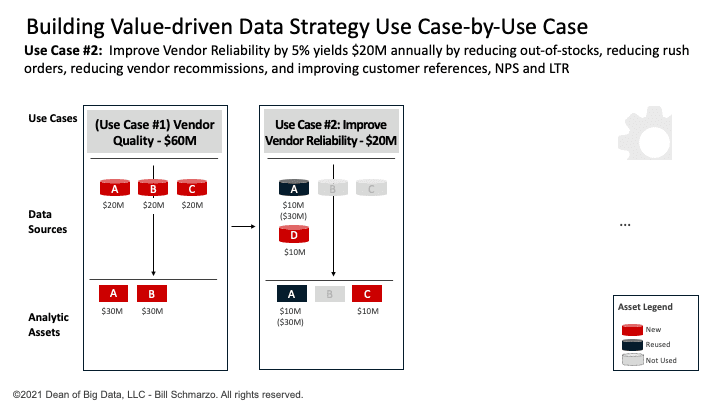
Figure 3: Use Case #2: Improve Vendor Reliability
Again, I’ve used a straight-line data valuation attribution model so that if the use case is worth $20M. There are 2 data sets and 2 analytic modules necessary to optimize the use case, then each data set gets one-half of the attributable value (1 ÷ 2 × $20M = $10M). The two analytic modules get half the attributable value (1 ÷ 2 × $20M = $10M). See Figure 4.
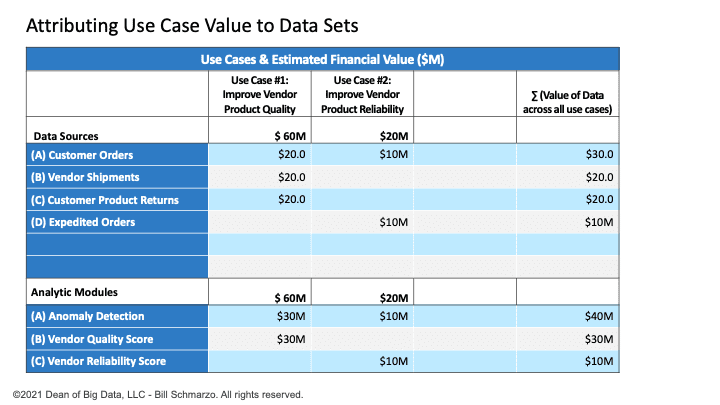
Figure 4: Value Attribution After Use Case #2
Use Case #3 Data Value Determination
Use Case #3 seeks to reduce component inventory costs by 5% yielding $60M in annual savings by reducing inventory out-of-stocks, reducing rush shipments, reducing unplanned product downtime, reducing excess inventory, reducing obsolete inventory, reducing vendor recommissions, and freeing up working capital.
The data science team has determined that Use Case #2 requires four data sets (reusing Customer Orders and Orders Shipments and adding Inventory and Supplier Orders) and three analytic modules (reusing Anomaly Detection, Vendor Quality Score, and Vendor Reliability Score). See Figure 5.
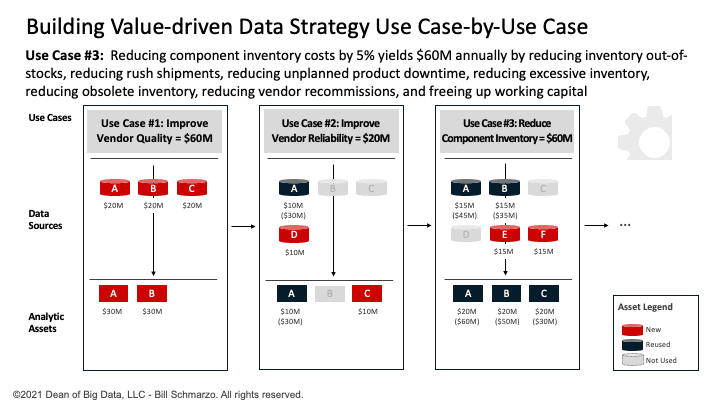
Figure 5: Use Case #1: Reduce Component Inventory Costs
Again, I’ve used a straight-line data valuation attribution model so that if the use case is worth $60M and there are 4 data sets and 3 analytic modules necessary to power that use case, then each data set gets one-fourth of the attributable value (1 ÷ 4 × $60M = $15M) and each of the three analytic modules gets one-third of the attributable value (1 ÷ 3 × $60M = $20M). See Figure 6.
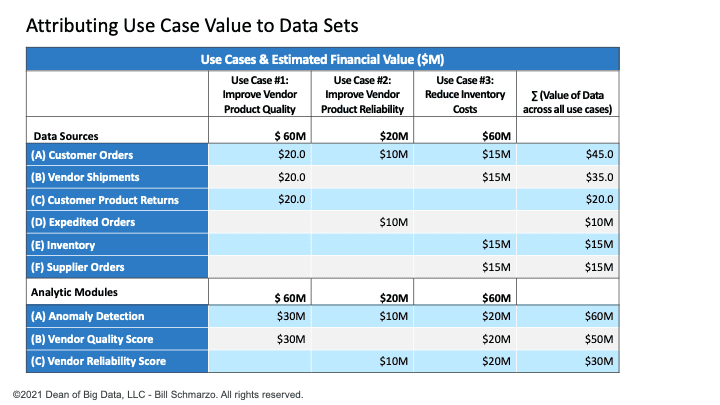
Figure 6: Value Attribution After Use Case #3
Data Valuation Methodology Summary
Okay, a very straight-forward approach to attributing the value of one’s data that requires the following:
- Understanding the value of each use case. This financial analyst exercise is probably already being done today, or should be.
- Determination of what data sets are required to optimize the use case. Seek progress over perfection to get some quick results upon which you can improve over time by adding new data sets and data transformations/enrichments.
- Determination of what analytic modules are required to optimize the use case. Again, seek progress over perfection to get some quick results upon which you can improve over time through the performance, reliability, and accuracy improvements to the analytic modules.
And, oh, you get a bonus from using this use-case-by-use-case approach; you activate the Schmarzo Economic Digital Asset Valuation Theorem (Figure 7).
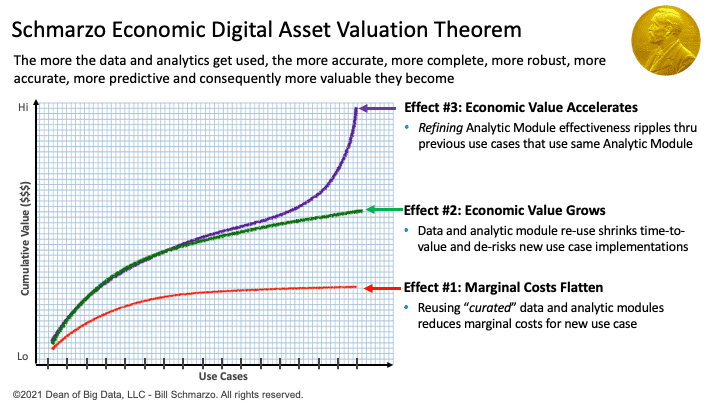
Figure 7: Schmarzo Economic Digital Asset Valuation Theorem
The Schmarzo Economic Digital Asset Valuation Theorem states that organizations can realize three effects or benefits from the sharing, reuse, and continuous refinement of the organization’s data and analytic assets (see Figure 3):
- Effect #1: Reduction in marginal costs in each subsequent business and operational use case through the reuse of data and analytic assets
- Effect #2: Growth in marginal value as the reuse of the data and analytic assets shrinks time-to-value and de-risks each subsequent business and operational use case
- Effect #3: Accelerated growth in economic value through the continuous refinement of the analytics data and analytic assets, which ripples predictive improvements through all the previous use cases that used those same data and analytic assets.
So now you’ve got that going for you, which is nice.
To learn more about data economics, check out my book, “The Economics of Data, Analytics, and Digital Transformation.”