
I have included a lot of Excel spreadsheets in the numerous articles and books that I have written in the last 10 years, based either on real life problems or simulations to test algorithms, and featuring various machine learning techniques. It is time to create a new blog series focusing on these useful techniques that can easily be handled with Excel. Data scientists typically use programming languages and other visual tools for these techniques, mostly because they are unaware that it can be accomplished with Excel alone. This article is my first one in this new series. The series will appeal to BI analysts, managers presenting insights to decision makers, as well as software engineers or MBA people who do not have a strong data science background. It can also be used as a starting point to learn data science and machine learning, by first solving problems in Excel, before discovering Excel’s limitations and then move to programming languages or AI-based automated coding.
Many of the techniques presented in my spreadsheets are data-driven (as opposed to model-driven), robust, simple yet efficient, sometimes entirely novel, and do not lead to problems such as over-fitting or numerical instability. Even in the absence of statistical models, confidence intervals can still be built – even in Excel – and are more intuitive and easy to understand than traditional ones. See my previous article here on general regression, as an example. That article also features traditional regression performed with the not well-known Excel built-in function LINEREST; with a simple transformation, it could be used for logistic regression. Also, my spreadsheets are just basic Excel, without using special Excel libraries or add-ins, and are thus accessible to everyone.
In this first blog, I show you how to simulate clustered data and display it with multi-groups scatterplots, things that I used to do with R in the past.
Excel scatterplots in clustering contexts
The pictures below represents a simulation of clustered data: 177 two-dimensional data points spread across three clusters.
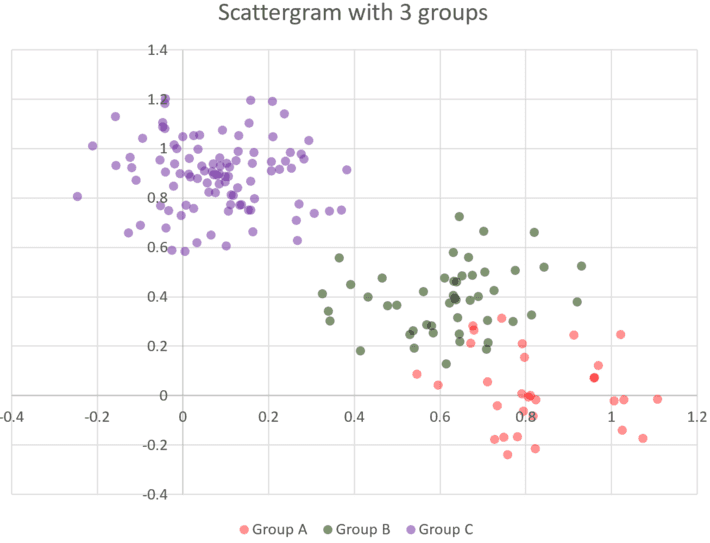
Figure 1: Well separated clusters
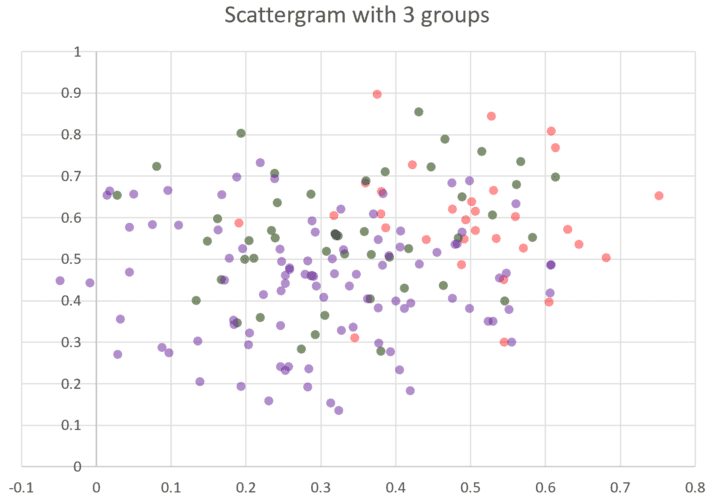
Figure 2: Overlapping clusters
The spreadsheet used to produce these charts is interactive, and you can play with it to generate more clusters, fine-tune the level of overlapping, and to test various clustering algorithms on the simulated data that you create, using cross-validation techniques, to see how they perform. The points, within each of the three groups, are radially distributed around a center. That is, a random point (X, Y) in group #1, assuming the center of that group – also randomly distributed – is (X1, Y1) is generated as follows:
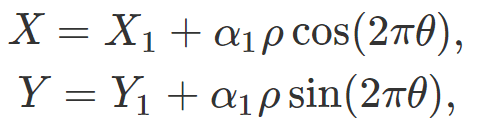
Here, different random deviates ρ, θ uniformly distributed on [0, 1] are used for each (X, Y) using the function RAND in Excel, and the constant α1 is fixed for all points in group #1. In the spreadsheet, the three centers are uniformly distributed on [0, 1] x [0, 1], and α1, α2, α3 are set to 1/3.
The scatterplots are produced using the scatter graph in Excel, applied to data separated in three groups as illustrated in the screenshot below. For group #1, point coordinates (X, Y) are stored in the first and second column respectively. For group #2, it’s in the first and third column, and for group #3, it is in the first and fourth column as illustrated below.
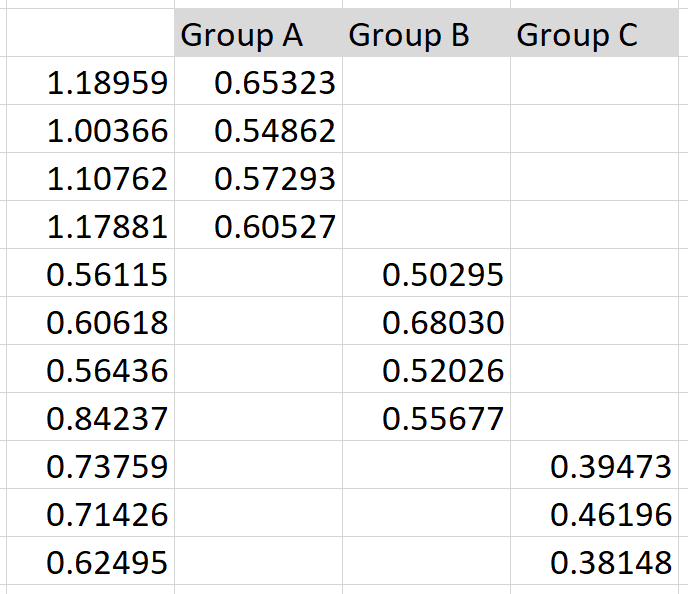
Figure 3: Organizing the data in Excel to produce the scatterplots
The spreadsheet is available for download, here (scatter-cluster.xlsx). See also one of my previous spreadsheets to automatically detect the number of clusters, from one of my past articles, here (elbow.xlsx, in the the section Elbow Strength with spreadsheet illustration). Finally, many spreadsheets are available for download, from my most recent book Statistics: new foundations, toolkit, and machine learning recipes, here. Some of them even perform NLP algorithms.
About the author: Vincent Granville is a data science pioneer, mathematician, book author (Wiley), patent owner, former post-doc at Cambridge University, former VC-funded executive, with 20+ years of corporate experience including CNET, NBC, Visa, Wells Fargo, Microsoft, eBay. Vincent also founded and co-founded a few start-ups, including one with a successful exit (Data Science Central acquired by Tech Target). You can access Vincent’s articles and books, here.