
Determining the number of clusters when performing unsupervised clustering is a tricky problem. Many data sets don’t exhibit well separated clusters, and two human beings asked to visually tell the number of clusters by looking at a chart, are likely to provide two different answers. Sometimes clusters overlap with each other, and large clusters contain sub-clusters, making a decision not easy.
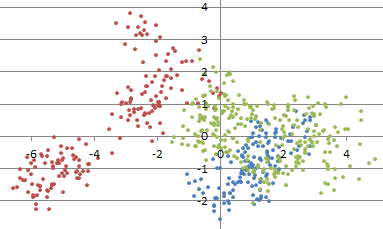
For instance, how many clusters do you see in the picture below? What is the optimum number of clusters? No one can tell with certainty, not AI, not a human being, not an algorithm.
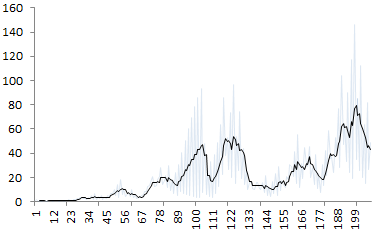
How many clusters here? (source: see here)
In the above picture, the underlying data suggests that there are three main clusters. But an answer such as 6 or 7, seems equally valid.
A number of empirical approaches have been used to determine the number of clusters in a data set. They usually fit into two categories:
- Model fitting techniques: an example is using a mixture model to fit with your data, and determine the optimum number of components; or use density estimation techniques, and test for the number of modes (see here.) Sometimes, the fit is compared with that of a model where observations are uniformly distributed on the entire support domain, thus with no cluster; you may have to estimate the support domain in question, and assume that it is not made of disjoint sub-domains; in many cases, the convex hull of your data set, as an estimate of the support domain, is good enough.
- Visual techniques: for instance, the silhouette or elbow rule (very popular.)
In both cases, you need a criterion to determine the optimum number of clusters. In the case of the elbow rule, one typically uses the percentage of unexplained variance. This number is 100% with zero cluster, and it decreases (initially sharply, then more modestly) as you increase the number of clusters in your model. When each point constitutes a cluster, this number drops to 0. Somewhere in between, the curve that displays your criterion, exhibits an elbow (see picture below), and that elbow determines the number of clusters. For instance, in the chart below, the optimum number of clusters is 4.
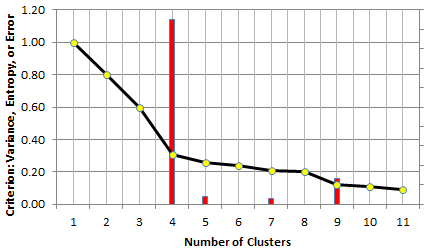
The elbow rule tells you that here, your data set has 4 clusters (elbow strength in red)
A good reference on the topic is this article. Some R functions are available too, for instance fviz_nbclust. However, I could not find in the literature, how the elbow point is explicitly computed. Most references mention that it is mostly hand-picked by visual inspection, or based on some predetermined but arbitrary threshold. In the next section, we solve this problem.
1. Automating the elbow rule
This is another example showing how data science can automate some tasks performed by statisticians, in this case in the context of exploratory data analysis. The solution is actually pretty simple, and applies to many problems not even related to clustering, that we will discus in the next section. Also, it is not limited to using the percentage of unexplained variance (Y- axis) to plot the elbow curve, but other criteria such as entropy, or error resulting from model fitting, work equally well. Indeed the solution provided here was designed to be integrated in black-box decision systems. The only requirement is that the elbow curve most be positive (above the X-axis) and decreasing.
Elbow strength (with spreadsheet illustration)
The formula to compute the elbow strength (the core concept in this article) is illustrated using the table below (corresponding to to the figure in section 1) and available in our interactive spreadsheet (download the spreadsheet here).
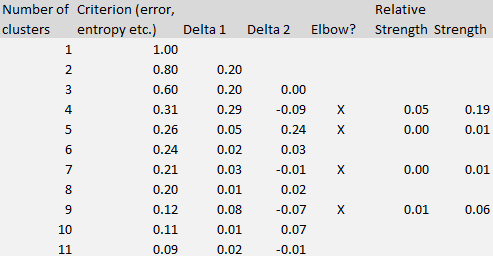 The Delta 1 column in the table represents the differences between k and k + 1 clusters, measured on the criterion metric (the second column.) Delta 2 represents the difference computed on Delta 1, that is, the second-order differences. The strength (rightmost column) at line k (k is the number of clusters) is computed as the difference between Delta 2 and Delta 1, at line k +1. It is shown only if it is positive.
Number of clusters
The optimum number of clusters is the value of k that maximizes the strength. That’s it!
The strength tells, for a specific k, if there is a potential elbow at level k (corresponding to k clusters), and how strong the elbow signal is at that level. Sometimes the strongest signal is not the first one, though this is usually the case in many instances. Below is an example where this is not the case.
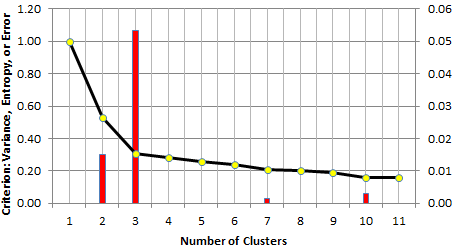
The above picture exhibits a situation where the data could conceivably have 2 or 3 clusters. However, the assumption of 3 clusters (instead of 2) is much more plausible, based on the height of the red bars. Rather than using the strength of the elbow, I actually used the relative strength: it is the strength, divided by k (the number of clusters). The relative strength dampens the strength of the elbow for large values of k, as these are usually less meaningful.
Testing
Three types of tests are worth doing to further assess the value of this method.
- Test with various elbow curves: we created curves, with multiple elbows or barely any elbow, to check the results produced by our procedure. We did not find counter-examples. Some of the test curves are included in our spreadsheet. Interestingly, if the shape of the elbow curve is like 1 / k, then two clusters are detected, which conforms to intuition. If is is decreasing at a much smaller pace, then the curve is too smooth to produce red bars, and no elbow is detected. This also conforms to intuition.
- Test on real data: these tests can be more difficult to interpret, since in many cases, nobody can tell the number of clusters, unless clusters are well separated, or known a-priori.
- Test with simulated data: it is easy to generate data with a known number of clusters, see here. Then one can use a criterion, such as percentage of unexplained variance, and look at the elbow curve, to check when it correctly predicts the number of clusters. Below is an example of simulated clusters.
Simulated cluster structure to test the elbow rule (see here for source code)
Stopping rule for clustering algorithms
One open question is how the methodology performs when the data has more than two dimensions. The issue is not with the elbow curve itself, but with the criterion being used. Finally, when large clusters are found in a data set (especially with hierarchical clustering algorithms) it is a good idea to apply the elbow rule to any big cluster (split the big cluster into smaller clusters), in addition to the whole data set. In practice, once you hit the first red bar (or if there is another red bar just after the first one, and bigger than the first one), you can stop refining and splitting your clusters: you have reached an empirical optimum.
2. Patenting the concept, other applications
The elbow rule can be used in various applications, not just to detect the number of clusters. We used it to detect how many decimals are correctly computed when using high precision computing libraries in Perl and Python, for a specific problem. You can check it out in my book on applied stochastic processes (available here) page 48. I also discuss the elbow rule in my optimum data binning procedure, see here. In time series, the elbow is sometimes referred to as a change point, signaling a change in the slope, and the elbow method can be used to identify these change points.
In fact, the elbow method can be used in any algorithm that has a stopping rule, where the criterion used to measure performance improvement at each new iteration, is a positive decreasing function. In particular, it can be used to detect how deep a decision tree should be (when to stop splitting nodes), or in numerical algorithms to detect when the accuracy level reached is good enough, and no longer steadily improving when adding more iterations.
After searching the literature for the formula used in the elbow rule, and not finding anything, I decided to look whether some companies had filed patents on this topic. Interestingly, I found the following ones, among others:
- IBM: Cluster evaluation in unsupervised learning of continuous data
- Google: Scalable system for K-means clustering of large databases
- Microsoft: Automatic determination of the number of clusters by mixtures of ba…
Yet none of them mention the elbow rule, even though Microsoft’s patent has a section on Automatic Determination of the Number of Hidden Clusters. Surprisingly, it has also a section on collaborative filtering. The patent was filed in 1998 and issued in 2004.
Chances are that you might still be able to file a patent about my elbow rule methodology, though it is now public domain because of this very article (and the formula was mentioned first in one of my previous articles in 2011, here.) If a company is interested in patenting the concept with me, I can be reached at [email protected] I have been granted patents pertaining to data science in the past, see here. I am currently working on a model-free, data-driven methodology to determine the optimum sample size with great accuracy. To not miss my next article on this topic, sign-up here to receive our newsletter. For inquiries about patenting the concept discussed in this article, or any other one, including my upcoming article about sampling, email me.
To not miss this type of content in the future, subscribe to our newsletter. For related articles from the same author, click here or visit www.VincentGranville.com. Follow me on on LinkedIn, or visit my old web page here.
DSC Resources
- Free Book and Resources for DSC Members
- New Perspectives on Statistical Distributions and Deep Learning
- Deep Analytical Thinking and Data Science Wizardry
- Statistical Concepts Explained in Simple English
- Machine Learning Concepts Explained in One Picture
- Comprehensive Repository of Data Science and ML Resources
- Advanced Machine Learning with Basic Excel
- Difference between ML, Data Science, AI, Deep Learning, and Statistics
- Selected Business Analytics, Data Science and ML articles
- Hire a Data Scientist | Search DSC | Find a Job
- Post a Blog | Forum Questions