
The job of data scientist — the quintessential big data job, and the job that was just voted the best job in America for 2016 — is at risk.
Data scientists have been called “unicorns” because finding the right person with the right set of skills — including coding, statistics, machine learning, database management, visualization techniques, and industry-specific knowledge — could be practically impossible. But machine learning and big data itself may be making those unicorns as obsolete as they are mythical.
New machine learning algorithms can autonomously analyze data and identify patterns, even interpret the data and produce reports and data visualizations.
You (and your computer) can be your own data scientist
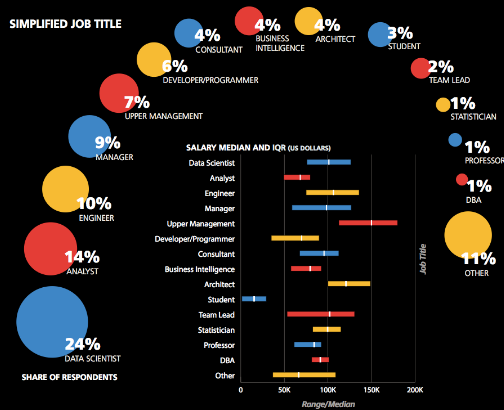
Source for picture: click here
While most people can see how certain information would be useful and what sort of insights might be derived from it, most lack the technical skills to perform the analytics. They might not have the computers that are able to carry out the large volume of calculations quickly enough to take action, but more often they lack the analytical skills to tell that computer what to do.
Natural Language Processing (NLP) technologies can help to break down the barriers to widespread use of data analytics by making complex analytics possible to just about anyone, regardless of their technical ability. In essence, NLP is teaching computers to accept input in the natural, spoken language of humans – eliminating the communications barrier between man and machine.
IBM, for example, believes that it can offer a solution to the skills shortage in big data by cutting out the data scientists entirely and replacing (or supplementing) them with its Watson natural language analytics platform.
IBM’s Vice President for Watson Analytics and business intelligence, Marc Altshuller, explains “With a cognitive system like Watson you just bring your question – or if you don’t have a question you just upload your data and Watson can look at it and infer what you might want to know.
“A traditional data scientist might receive training in R or SAS or whatever tool their school uses, but we found in the ‘citizen analyst’ area, they were often being given the wrong tools where they were required to guess the right answer, and then test their guess.”
I believe that Watson, and other NLP or cognitive technologies, will play an important role in the future of analytics and the education around it. As the value of data analytics becomes apparent in all fields of activity, a growing number of people will want to be able to extract insights from their data. They might not want to take three or four years out to learn advanced computer science and statistics, and with the advances in cognitive computing that won’t be necessary. All that is required might be a brief introduction to NLP technologies.
Gartner forecasts that the need for so-called ‘citizen data scientists’ — people who are in job roles that are not primarily about analytics but who could benefit from using data-driven insights — is going to grow five times faster than the need for highly skilled data science specialists. And it is these ‘citizen analysts’ that IBM is hoping to attract to working with Watson.
Visualizations at the click of a button
In addition, new technologies are emerging that will allow lay people in any field to create detailed infographics and other storytelling devices to help interpret the data NLP technologies will return.
Visualizations are usually used as a layer on the top of data, designed to make the data more digestible.
In big data analytics, reporting the insights we’ve gleaned from analyzing large amounts of messy data sets is the crucial “last step” of the process – and it’s often a step which causes us to stumble. We may have crunched terabytes of data in real time to come up with our world changing revelations. But unless we can communicate them convincingly to those who need to take action, they are useless, and worse than that, a waste of valuable time and money.
This is why data analysts have come to rely increasingly on graphics and visualizations combined with text – such as the now ubiquitous “Infographics” – to get a message across. But infographics rarely tell the whole story, and are still generally issued alongside written reports or summaries, particularly if they have a corporate purpose and detail is required. Again, this takes time and effort.
Programs that can visualize data start with the graphing functions available in Excel and get progressively more complex. But one program, called Quill, takes the trend a step further, producing text-based reports that explain the data clearly and concisely. Think of it as an executive summary created by a computer to explain a set of data. At the click of a button.
Combined, these types of technologies mean that the human interface — the data scientist — may soon be as mythical as that unicorn, and simply unneeded in the big data landscape where lay persons can conduct their own analytics at will.
DSC Resources
- Career: Training | Books | Cheat Sheet | Apprenticeship | Certification | Salary Surveys | Jobs
- Knowledge: Research | Competitions | Webinars | Our Book | Members Only | Search DSC
- Buzz: Business News | Announcements | Events | RSS Feeds
- Misc: Top Links | Code Snippets | External Resources | Best Blogs | Subscribe | For Bloggers
Additional Reading
- What statisticians think about data scientists
- Data Science Compared to 16 Analytic Disciplines
- 10 types of data scientists
- 91 job interview questions for data scientists
- 50 Questions to Test True Data Science Knowledge
- 24 Uses of Statistical Modeling
- 21 data science systems used by Amazon to operate its business
- Top 20 Big Data Experts to Follow (Includes Scoring Algorithm)
- 5 Data Science Leaders Share their Predictions for 2016 and Beyond
- 50 Articles about Hadoop and Related Topics
- 10 Modern Statistical Concepts Discovered by Data Scientists
- Top data science keywords on DSC
- 4 easy steps to becoming a data scientist
- 22 tips for better data science
- How to detect spurious correlations, and how to find the real ones
- 17 short tutorials all data scientists should read (and practice)
- High versus low-level data science
Follow us on Twitter: @DataScienceCtrl | @AnalyticBridge