
P-values are used in statistics and scientific publications, much less so in machine learning applications where re-sampling techniques are favored and easy to implement today thanks to modern computing power. In some sense, p-values are a relic from old times, when computing power was limited and mathematical / theoretical formulas were favored and easier to deal with than lengthy computations.
Recently, p-values have been criticized and even banned by some journals, because they are used by researchers, who cherry-pick observations and repeat experiments until they obtain a p-value worth publishing to obtain grant money, get tenure, or for political reasons. Even the American Statistical Association wrote a long article about why to avoid p-values, and what you should do instead: see here. For data scientists, obvious alternatives include re-sampling techniques: see here and here. One advantage is that they are model-independent, data-driven, and easy to understand.
Here we explain how the manipulation and treachery works, using a simple simulated data set consisting of purely random, non-correlated observations. Using p-values, you can tell anything you want about the data, even the fact that the features are highly correlated, when they are not. The data set consists of 16 variables and 30 observations, generated using the RAND function in Excel. You can download the spreadsheet here.
There is a total of (16 x 15) / 2 = 120 correlations (one for each pair of variables) and as you compute them one by one, you are bound, sooner rather than later, to find one that is significant. The most extreme correlation will almost always be above 0.4 in absolute value if you have 16 variables and 30 observations that are totally random. This is a statistically significant departure from zero. If you pick up that extreme correlation, now you can tell that my data set is not random, and that the chance for such a high correlation to occur is indeed 1/120. This number (1/120) is also your p-value, which is well below 5%, the threshold usually accepted to prove that the effect in question did not occur by chance. The truth is that it really did occur by chance: you were just cherry-picking. 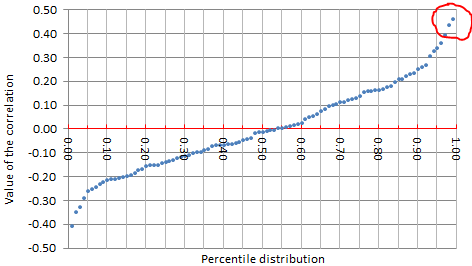
The way the scheme works is by picking the least extreme case that meets your agenda (circled in red in the above picture), in this case a target p-value below 1%.
If you were to write an article about Excel using this faulty argumentation, you could claim, based on this experiment, that the random number generator in Excel is wrong and produces correlated numbers. You could do the same experiment in Python and come to the same conclusion. Or you could use a genuine hardware-based device that truly produces randomness, and still come to the same conclusion. Indeed you could write a philosophical article about the fact that randomness does not exist. You could also do the same experiment using the Perl programming language and come to the same conclusion. In this latter case interestingly, you would be correct: Perl’s random number generator has a major design flaw (it can produce only 32,767 distinct values) but this little experiment would not be able to reveal this fact. You would be correct about Perl’s faulty random numbers, but you would be correct just by chance, not because you used a sound methodology to identify the issue.
For more about correlations, read my previous article.
To not miss this type of content in the future, subscribe to our newsletter. For related articles from the same author, click here or visit www.VincentGranville.com. Follow me on on LinkedIn, or visit my old web page here.