
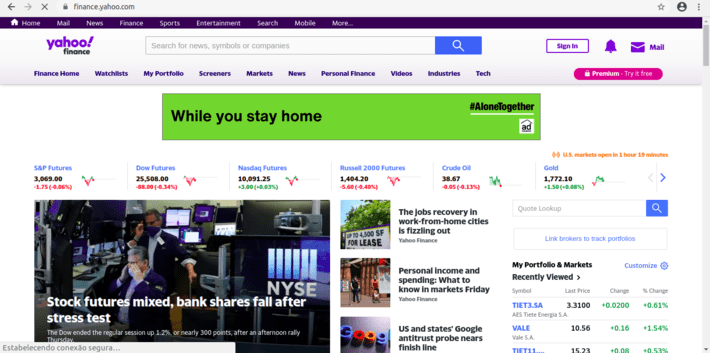
Yahoo Finance (below) is a website that gives us a good deal of information about the financial market, including information about stock trading.
To get the numbers for a specific stock, all you have to do is to search for its Yahoo code (ex: VALE – see figure below). This is not necessarily the company’s trading code at the market, but its representation in Yahoo Finance.
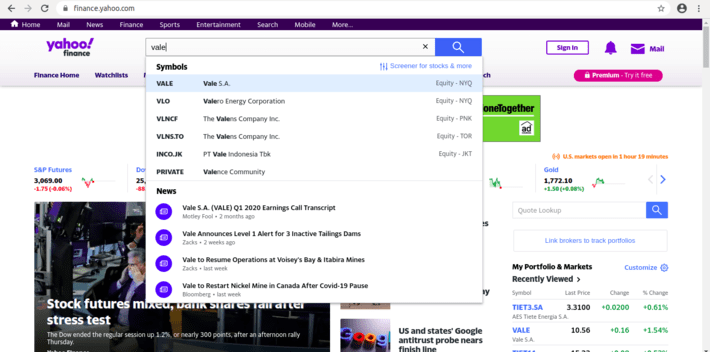
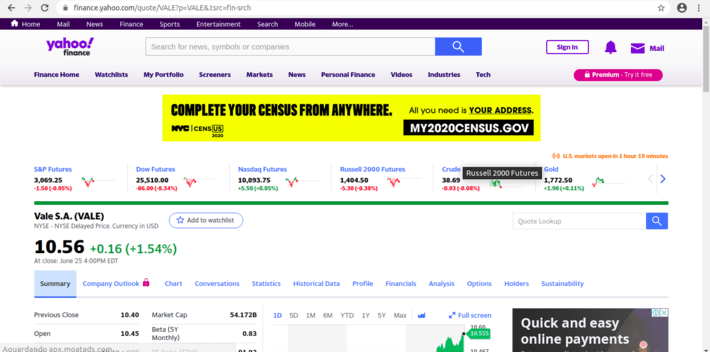
The platform will then show you some free information, both technical and fundamental, about the desired company and stock (naturally, the best pieces are kept for Yahoo Finance’s premium accounts).
Still, what interests us here is the historical price series, which is for free. Before going any further, however, it’s worth mentioning that, even though Yahoo Finance actually had, at some point, an API of its own, apparently due to some legal problems they had to discontinue it. There are some other APIs out there, such as the one provided by RapidAPI, but these are non-official and limited in their free accounts. I know of no one providing a free API specifically to R.
Downloading Historical Data
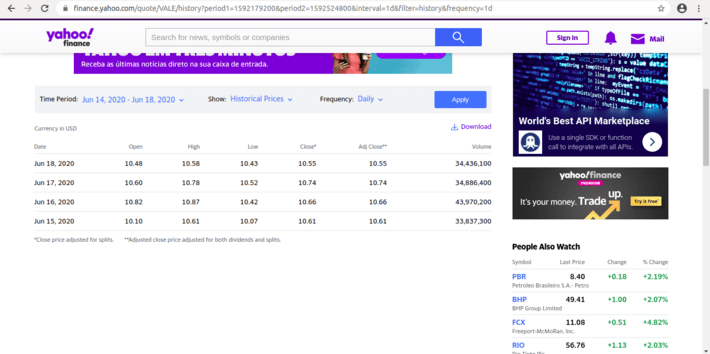
The idea here is to download the time series returned by Yahoo Finance when, from its webpage, we choose a time period and frequency, and then hit the Apply button (below).
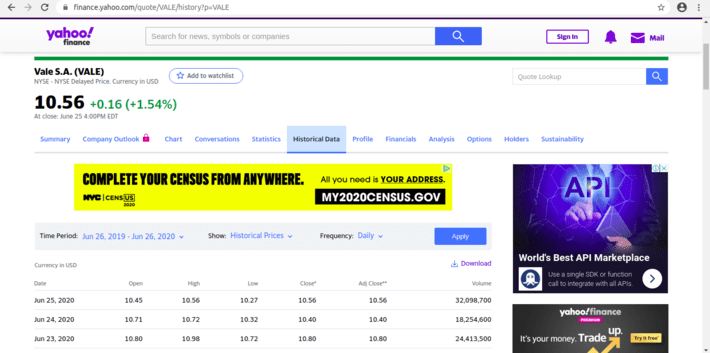
The returned time series can be downloaded (as a .csv file) by clicking the Download button. What we are going to do is to simulate this click, by sending Yahoo’s servers the same request this button would.
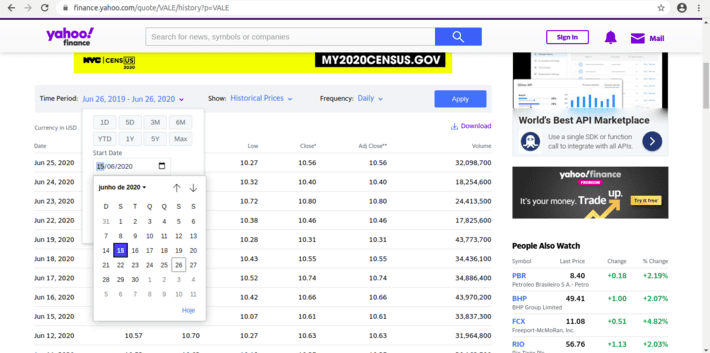
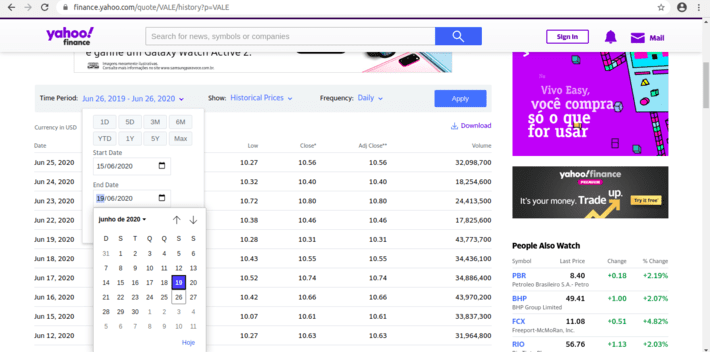
But before that, there is one odd behaviour you should notice in Yahoo Finance’s website, and that is related to the time period you choose. Let’s suppose you wish to change this period. You click on it, and chooses a start and end date. In this case, you wanted the period to span from 15/06/2020 to 19/06/2020, as shown below.
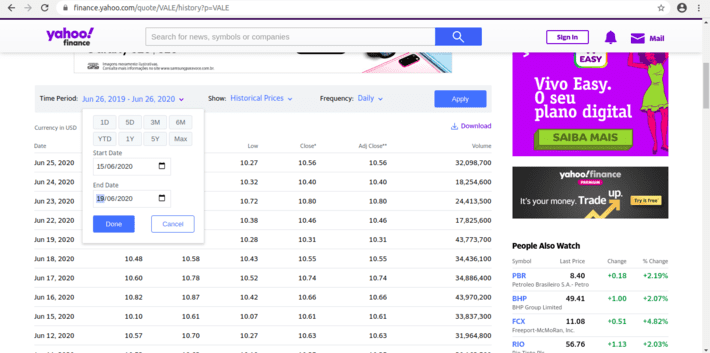
What happens then is very odd. By clicking on Done, you’ll see a page showing a different period, in this case 14/06/2020 to 18/06/2020 (the day before the dates you’ve set).
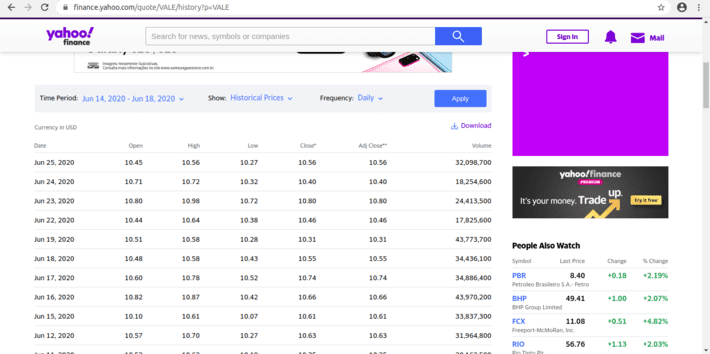
And to get matters even more confusing, after clicking on Apply, Yahoo will show you data from 15/06/2020 to 18/06/2020:
Our mission is then to map the desired time period (15/06/2020 to 19/06/2020) into the URL generated by the Download button which, in this example, is
query1.finance.yahoo.com/v7/finance/download/VALE? period1=1592179200&period2=1592524800&interval=1d&events=history
Assembling the Query
As you may have already noticed, Yahoo Finance’s query follows the pattern
query1.finance.yahoo.com/v7/finance/download/STOCK_CODE?period1=START_DATE&period2=END_DATE&interval=INTERVAL&events=history
where STOCK_CODE is Yahoo’s stock code (in our example, VALE), START_DATE and END_DATE are the start and end dates, respectively, of the retrieved period, and INTERVAL is the time interval of each record (in this case, we have worked with daily records – 1d).
STOCK_CODE and INTERVAL are not so hard to get. The problem is how to get from 15/06/2020 to 1592179200 and from 19/06/2020 to 1592524800. Let’s forget, for the moment, we wanted data to span from 15/06 to 19/06, and focus on the data returned by the website.
As it turns out, Yahoo Finance represents time as the number of seconds since the beginning of 1970, UTC. In R, that corresponds to the POSIXct class. So let’s try it out:
t1 <- ISOdate(2020,6,15) as.integer(t1)## [1] 1592222400Not quite so. What happened is that ISOdate function is defined as
ISOdate(year, month, day, hour = 12, min = 0, sec = 0, tz = “GMT”)
That is it gives us the number of seconds at noon. So let’s set it to the beginning of 15/06:
t1 <- ISOdate(2020,6,15,hour=0) as.integer(t1)## [1] 1592179200and voilà. What about 19/06/2020? Well, it turns out that both dates are codified as
t1 <- ISOdate(2020,6,15,hour=0)
 t2 <- ISOdate(2020,6,19,hour=0)
 as.integer(t1)
## [1] 1592179200as.integer(t2)## [1] 1592524800Now we see both 1592179200 and 1592524800 from the URL. This also explains why we asked for data up to 19/06 and got only up to 18/06: markets were closed by 00:00 19/06/2020. This is something you must correct for, if you should stay faithful to your original query. Fortunately, this correction is easy: all you have to do is to ask for data from the next day, or from midnight. So both
as.integer(ISOdate(2020,6,19,hour=24))## [1] 1592611200as.integer(ISOdate(2020,6,20,hour=0))## [1] 1592611200will return the desired number. Or you might just forget about it, as I did in this example.
So, the URL in our example may finally be assembled with
stock <- "VALE"
url <- paste("https://query1.finance.yahoo.com/v7/finance/download/",
 stock,
 "?period1=",
 as.integer(t1),
 "&period2=",
 as.integer(t2),
 "&interval=1d&events=history",
 sep="")
 url
## [1] "https://query1.finance.yahoo.com/v7/finance/download/VALE?period1=1592179200&period2=1592524800&interval=1d&events=history"(here I kept the 1d interval, but obviously you can change it at will).
Downloading the .csv File
Now that we have the URL, all we have to do is to download the file. To do this, an alternative would be
dataset <- read.csv(url)
and you’ll have your data frame with Yahoo Finance’s data.
str(dataset)
## 'data.frame':    4 obs. of  7 variables:
##  $ Date     : Factor w/ 4 levels "2020-06-15","2020-06-16",..: 1 2 3 4
 ##  $ Open     : num  10.1 10.8 10.6 10.5
 ##  $ High     : num  10.6 10.9 10.8 10.6
 ##  $ Low      : num  10.1 10.4 10.5 10.4
 ##  $ Close    : num  10.6 10.7 10.7 10.6
 ##  $ Adj.Close: num  10.6 10.7 10.7 10.6
 ##  $ Volume   : int  33837300 43970200 34886400 34436100
But that comes for a price
- Every time we run our code, we download the very same dataset; and
- We must save dataset if we wish to use it offline in the future
Alternatively, we could download a local copy of the data
fileName <- "my_dataset.csv"
 download.file(url, fileName)
and read it whenever we feel like
dataset2 <- read.csv(fileName)
str(dataset2)## 'data.frame': 4 obs. of 7 variables:
## $ Date : Factor w/ 4 levels "2020-06-15","2020-06-16",..: 1 2 3 4
## $ Open : num 10.1 10.8 10.6 10.5
## $ High : num 10.6 10.9 10.8 10.6
## $ Low : num 10.1 10.4 10.5 10.4
## $ Close : num 10.6 10.7 10.7 10.6
## $ Adj.Close: num 10.6 10.7 10.7 10.6
## $ Volume : int 33837300 43970200 34886400 34436100There you are. Your dataset is ready for action.
And that’s all for the moment. Hope you find this small contribution useful.