
This article was written by Stephanie and Tony on R2D3.
In machine learning, computers apply statistical learning techniques to automatically identify patterns in data. These techniques can be used to make highly accurate predictions. Using a data set about homes, we will create a machine learning model to distinguish homes in New York from homes in San Francisco.
First, some intuition
Let’s say you had to determine whether a home is in San Francisco or in New York. In machine learning terms, categorizing data points is a classification task.Since San Francisco is relatively hilly, the elevation of a home may be a good way to distinguish the two cities. Based on the home-elevation data to the right, you could argue that a home above 240 ft should be classified as one in San Francisco.
Adding nuance
Adding another dimension allows for more nuance. For example, New York apartments can be extremely expensive per square foot. So visualizing elevation and price per square foot in a scatterplot helps us distinguish lower-elevation homes. The data suggests that, among homes at or below 240 ft, those that cost more than $1776 per square foot are in New York City. Dimensions in a data set are called features, predictors, or variables. 1
Drawing boundaries
You can visualize your elevation (>242 ft) and price per square foot (>$1776) observations as the boundaries of regions in your scatterplot. Homes plotted in the green and blue regions would be in San Francisco and New York, respectively.
Identifying boundaries in data using math is the essence of statistical learning. Of course, you’ll need additional information to distinguish homes with lower elevations and lower per-square-foot prices. The dataset we are using to create the model has 7 different dimensions. Creating a model is also known as training a model. On the right, we are visualizing the variables in a scatterplot matrix to show the relationships between each pair of dimensions.
There are clearly patterns in the data, but the boundaries for delineating them are not obvious.
And now, machine learning
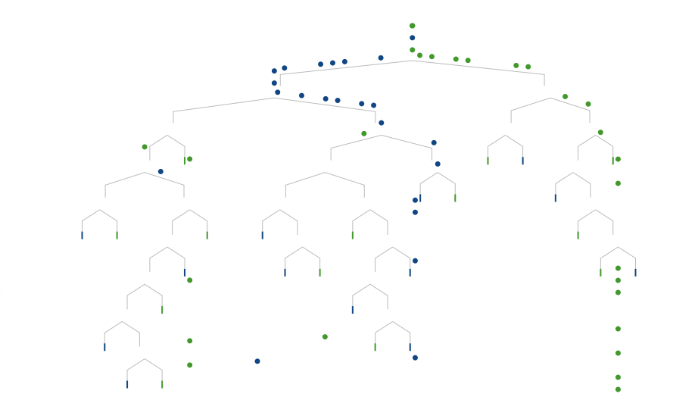
Finding patterns in data is where machine learning comes in. Machine learning methods use statistical learning to identify boundaries. One example of a machine learning method is a decision tree. Decision trees look at one variable at a time and are a reasonably accessible (though rudimentary) machine learning method.
What you will find in the full article:
- Finding better boundaries
- Your first fork
- Tradeoffs
- The best split
- Recursion
- Growing a tree
- Making predictions
- Reality check
To check out all this information, and play with a few cool interactive visualizations, click here.
- Article: Difference between Machine Learning, Data Science, AI, Deep Learnin…
- Article: What is Data Science? 24 Fundamental Articles Answering This Question
- Article: Hitchhiker’s Guide to Data Science, Machine Learning, R, Python
- Tutorial: Data Science Cheat Sheet
- Tutorial: How to Become a Data Scientist – On Your Own
- Categories: Data Science – Machine Learning – AI – IoT – Deep Learning
- Tools: Hadoop – DataViZ – Python – R – SQL – Excel
- Techniques: Clustering – Regression – SVM – Neural Nets – Ensembles – Decision Trees
- Links: Cheat Sheets – Books – Events – Webinars – Tutorials – Training – News – Jobs
- Links: Announcements – Salary Surveys – Data Sets – Certification – RSS Feeds – About Us
- Newsletter: Sign-up – Past Editions – Members-Only Section – Content Search – For Bloggers
- DSC on: Ning – Twitter – LinkedIn – Facebook – GooglePlus