
You don’t need a sophisticated model nor advanced machine learning techniques to quickly get a high level picture and trends for bottom-line business metrics. Not only the concepts explained here are easy to grasp, but while being high level, it nevertheless includes granular effects. The methodology presented here was used in business contexts in the past, when I was working with enterprise executives, particularly finance people, to assess the overall health of their business, and the short and long term impacts of new initiatives to boost growth. .
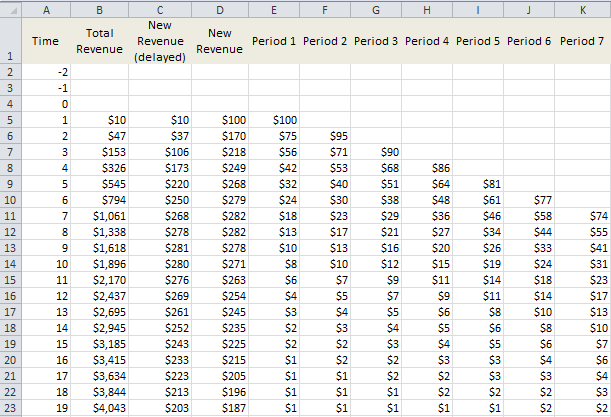
The model is available as an Excel spreadsheet, driven by four main parameters, as illustrated below. The growth can be in revenue, users, or any other fundamental metric. Time periods are measured in days when assessing the impact of an advertising campaign, or in months when assessing revenue growth caused by a new initiative. It typically involves the following dynamic:
- New growth occurs at each time period, for instance new users.
- It accumulates over time: new users become regular users, some of them eventually disappear — this can be factored in in the growth curve.
- There is usually a time lag between an action and a reaction: the effect of TV advertising campaigns may peak after a while (not immediately) and eventually decay.
You can play with these factors separately in the spreadsheet, and even having your data science team track them separately: these are the model components. If the growth is due to more than one action (for instance multi-channel advertising), you might want to use attribution modeling techniques to separate the different sources and avoid double counting: see here for details. Some parameters may change over time, as you approach market saturation, of return on advertising may slow down over time if the campaigns and targeting are left unchanged: see the saturation parameter in the spreadsheet. Finally, some parameters can be adjusted for seasonality or holidays.
Explanation
The two main columns are A and B, representing time and total revenue per time period. At each time period (columns E, F, and so on) new users are added, resulting from advertising efforts. They appear over the course of several time periods (for instance, cells E5 to E23 for the first batch of new users, corresponding to day 1 of your advertising campaign) and the number decays exponentially over time.
There is some erosion (saturation) in the advertising effectiveness: this is why E5 > F6 > G7 and so on. In addition, the revenue is delayed: this explains why columns C and D are different. But the sums over columns C and D are identical. Finally, there is attrition, which is incorporated in column B.
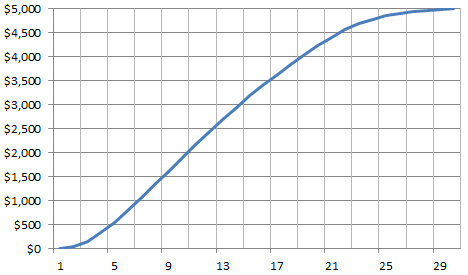
Growth curve corresponding to the above table (X-axis is the time period)
Parameters
The parameters are chosen to match the growth curve with actual data (past data, or training data.) Then the growth numbers are automatically computed for the future, as in the spreadsheet. You should work with BI analysts or data scientists to make sure that all the numbers and projections are sound. The parameters are found in the Parameter tab in the spreadsheet, and you can fine-tune them to automatically adjust the chart. The parameters are:
- Saturation: To model decline in advertising effectiveness, over time.
- Decay: Advertising done during one time period has impact over several time periods, with a decaying effect.
- Attrition: Proportion of users dying during any time period.
- Time lags: Revenue resulting from one column (advertising done during a specific time period) is spread over several rows (it is time-delayed).
The campaign to boost your metric starts at period 1 (row 5 in the spreadsheet.) You can download the spreadsheet here. See also this article. For a more technical presentation (fitting a growth curve with the logistic distribution), see a SAS article here. Our spreadsheet can model a large spectrum of growth scenarios, more than usually available in statistical packages.
To not miss this type of content in the future, subscribe to our newsletter. For related articles from the same author, click here or visit www.VincentGranville.com. Follow me on on LinkedIn, or visit my old web page here.