
Have you ever wondered how to segment your customers? Customer segmentation is a really useful technique to group similar customers together and understand what works for that. You can then tailor your offering and marketing messages to the specific segments. If you do it right, you should be able to see a healthy increase in sales. After all, companies like Amazon target their customers on an individual level so you should at least be targeting them on a segment level.
Originally Published on Ideatory Blog
There are some analytics techniques that can help you with segmenting your customers. These are useful especially when you have a large number of customers and it’s hard to discover patterns in your customer data just by looking at transactions. The two most common ones are:
- Clustering
- Principal Components Analysis (PCA)
Clustering
Clustering is an exploration technique for datasets where relationships between different observations may be too hard to spot with the eye. So you use mathematical equations to surface those relationships. Some mathematics is involved but is hidden behind the code. You can use R’s in-built help features to understand the mathematics further or refer to resources mentioned at the bottom.
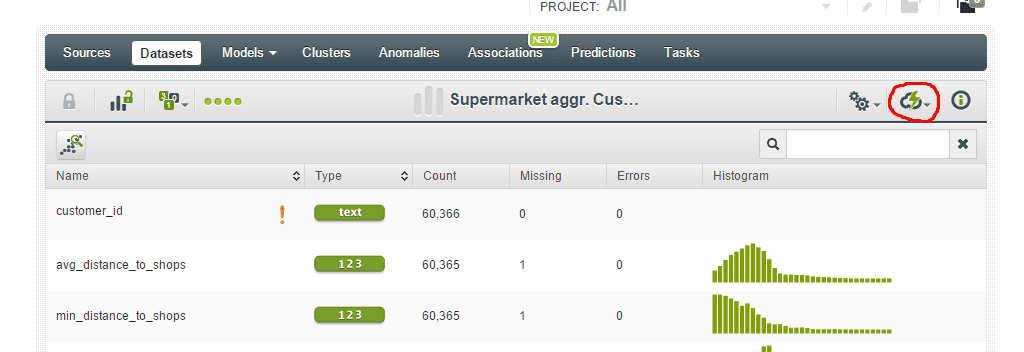
Shopping Dataset
So let’s take a supermarket shopping dataset available at BigML.com. You’d need to create an account on the site to get this dataset free of cost. Sure, this dataset would differ from your ecommerce dataset but the concepts and the approach would be the same.
Download the dataset from BigML by clicking on the cloud button and then clicking on “Request Export (CSV)”.
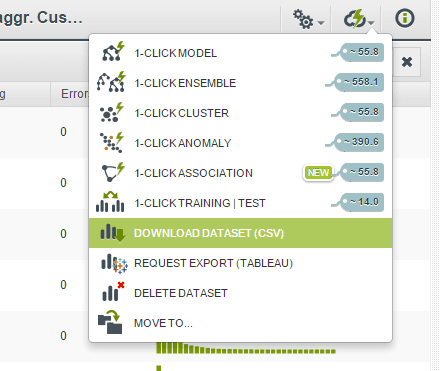
After some background processing, the “Request Export (CSV)” option will change to “Download Dataset (CSV)”.
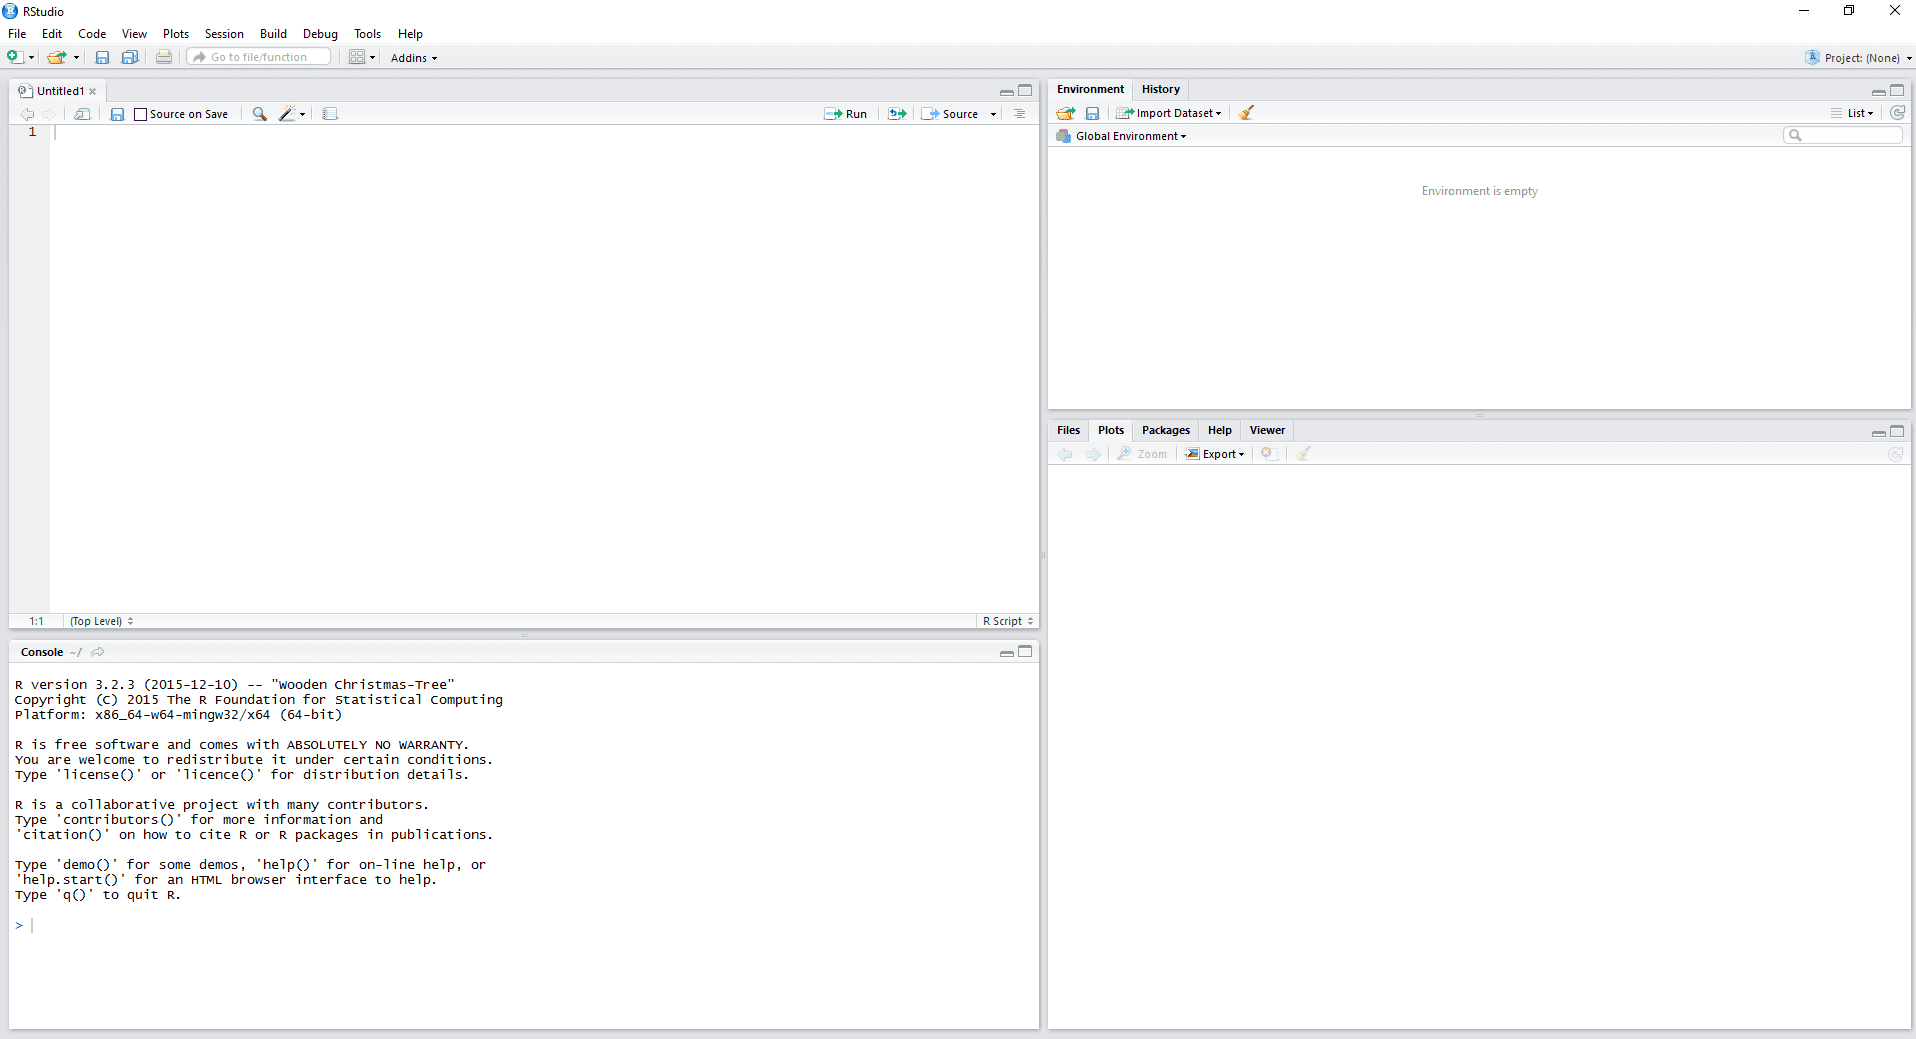
Save the dataset preferably in the working directory for your R application. If you don’t know where that is, go to R-studio and run this function:
getwd()
Save the dataset in csv format in the directory output by this function.
Objective/Hypothesis of the Analysis
After you’ve downloaded the dataset and opened it in any spreadsheet application, you will be able to see 40 fields. Study the fields and make sure you are able to understand what they mean.
I will focus on only the following 5 fields to show you the concept of clustering:
customer_idamount_purchased_shop_1amount_purchased_shop_2amount_purchased_shop_3amount_purchased_shop_4amount_purchased_shop_5
Since the dataset has over 60,000 rows, and my main objective is just to show you the process of clustering, let’s take the top 3000 observations and save that as a csv file in the same directory as “small_customer.csv”.
When you begin any kind of data analysis you should, as much as possible, start with a hypothesis and then perform analysis to test your hypothesis. My hypothesis is that customers can be grouped (clustered) according to where they shop the most. My null hypothesis (which I am trying to disprove) is that there are no groups(clusters) of customers based on where they shop.
H0: Customers cannot be clustered based on where they shop the most
Ha: Customers can be clustered based on where they shop the most
You can come up with your own hypotheses and perform clustering on the required fields accordingly.
Code in RStudio
Go ahead and fire-up R-Studio if you have not already.
# Load skmeans library
library(skmeans)
# Load the data into variable customerdata. You will need to use na.omit function
# to remove all rows with empty values otherwise this could cause errors.
# User as.matrix to convert data type to matrix as you need that for using
# skmeans. For more info on skmeans type “?skmeans”
customerdata <- as.matrix(na.omit(read.csv("small_customer.csv")))
# Save only the columns of interest 1,26,27,28,29,30 to another variable “customers.shop”
# which we will use for clustering
customers.shop <- customerdata[,c(1,26,27,28,29,30)]
# We are going to use only columns 26 to 30 for clustering customers. Clustering using
# customer_id does not make sense so in the next two steps we are going to
# make customer_id into row names and then strip the column from the “customers.shop” dataset
rownames(customers.shop) <- customerdata[,1]
customers.shop <- customers.shop[,-1]
# Perform clustering on customers.shop dataset and save results to
# customer.clusters.amount_purchased. We will split into 5 clusters.
customer.clusters.amount_purchased <- skmeans(customers.shop, 5, method="genetic")
# Aggregate results by mean to analyse how much on average customers in different clusters
# shopped from the 5 different shops
customerdata.aggregate.amount_purchased <- aggregate(customers.shop, by = list(customer.clusters.amount_purchased$cluster), mean)
# Create padding to add legend to barplot added in the step after this step
par(xpd=T, mar=par()$mar+c(0,0,4,4))
# Create barplot of the aggregated results using barplot() on transposed form
# of the “customerdata.aggregate.amount_purchased” dataset
barplot(t(customerdata.aggregate.amount_purchased[,-1]), main="amount_purchased_by_cluster", ylab="Total",
col=rainbow(5), space=0.1, cex.axis=0.8, las=1,
names.arg=c("Cluster1","Cluster2","Cluster3","Cluster4","Cluster5"), cex=0.8)
# Add the legend to interpret the results
legend(4.5, 7200, names(customerdata.aggregate.amount_purchased[,-1]), cex=0.8, fill=rainbow(5))
Results
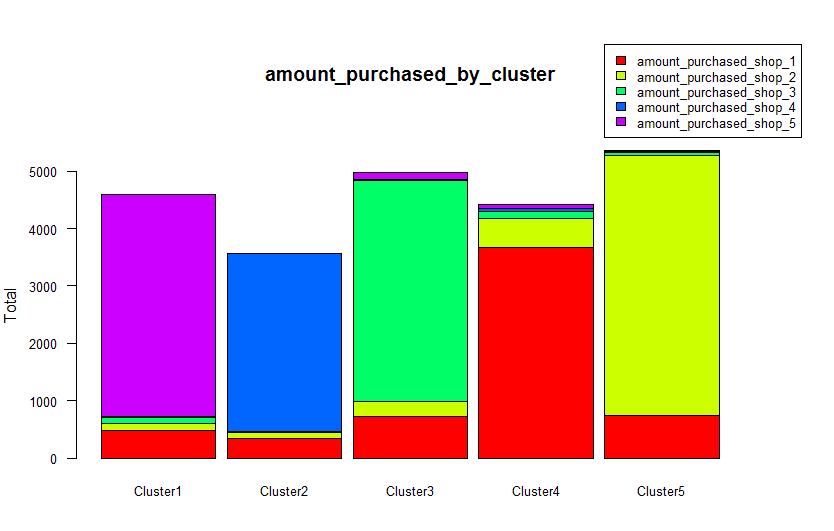
On plotting a histogram of the each cluster’s mean of amounts purchased from each of the 5 shops, it is clear that there do exist clusters of shoppers based on which shop they shop the most.
You can now use this kind insights to better focus your marketing efforts for each store to the right customers. In this specific case for example, if there is a competing store in the neighbourhood of Shop 3, you can send marketing material/discount coupons to only those customers who shop at Shop 3 and keep them from going to the competitor’s store. You would do this without wasting marketing dollars on sending coupons for Shop 3 to customers who usually shop at Shop 5. You could further use this data to understand shopping habits and estimate sales at planned new stores at different locations.
Try clustering the dataset in more ways and share in comments below if you find clusters based on other fields!
Feel free to leave comments if you have any questions.
References:
- Introduction to Statistical Learning: http://www-bcf.usc.edu/~gareth/ISL/
- Data Smart: http://as.wiley.com/WileyCDA/WileyTitle/productCd-111866146X.html
- Barplots: http://www.harding.edu/fmccown/r/
- Techniques for cluster plotting: http://stats.stackexchange.com/questions/31083/how-to-produce-a-pre…
