Originally posted onData Science Central
Do you want to learn the history of data visualization? Or do you want to learn how to create more engaging visualizations and see some examples? It’s easy to feel overwhelmed with the amount of information available today, which is why sometimes the answer can be as simple as picking up a good book.
These seven amazing data visualization books are a great place for you to get started:
1) Show Me the Numbers: Designing Tables and Graphs to Enlighten, Second Edition
2) The Accidental Analyst: Show Your Data Who’s Boss
3) Information Graphics
Sandra Rendgen, Julius Wiedemann
4) Visualize This: The FlowingData Guide to Design, Visualization, and Statistics
5) Storytelling with Data
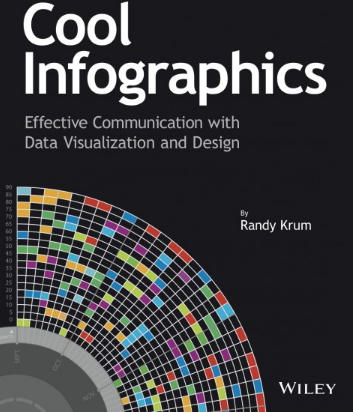
6) Cool Infographics
7) Designing Data Visualizations: Representing Informational Relationships
To check out the 7 data visualization books,click here. For other articles about data visualization,click here.
Top DSC Resources
- Article:What is Data Science? 24 Fundamental Articles Answering This Question
- Article:Hitchhiker’s Guide to Data Science, Machine Learning, R, Python
- Tutorial:Data Science Cheat Sheet
- Tutorial:How to Become a Data Scientist – On Your Own
- Categories:Data Science–Machine Learning–AI–IoT–Deep Learning
- Tools:Hadoop–DataViZ–Python–R–SQL–Excel
- Techniques:Clustering–Regression–SVM–Neural Nets–Ensembles–Decision Trees
- Links:Cheat Sheets–Books–Events–Webinars–Tutorials–Training–News–Jobs
- Links:Announcements–Salary Surveys–Data Sets–Certification–RSS Feeds–About Us
- Newsletter:Sign-up–Past Editions–Members-Only Section–Content Search–For Bloggers
- DSC on:Ning–Twitter–LinkedIn–Facebook–GooglePlus
Follow us on Twitter:@DataScienceCtrl|@AnalyticBridge

