
Anyone who attended statistical training at the college level has been taught the four rules that you should always abide by, when developing statistical models and predictions:
- You should only use unbiased estimates
- You should use estimates that have minimum variance
- In any optimization problem (for instance to compute an estimate from a maximum likelihood function, or to detect the best, most predictive subset of variables), you should always shoot for a global optimum, not a local one.
- And if you violate any of the above three rules, at least you need to make sure that your estimate, when the number of observations is large, satisfies them.
As a data scientist and ex-statistician, I violate these rules (especially #1 – #3) almost daily. Indeed, that’s part of what makes data science different from statistical science.
The reasons for violating these rules are:
- As long as the bias is not too strong, you are better off with a robust, outlier-insensitive estimate, than with an unbiased one. It would be interesting to do some analysis, to figure out the impact that a 10% bias has on your yield metric (measured as correctness of predictions, or revenue). The impact might be much smaller than 10%.
- Your model might be a bad model. It is better to reduce the variance generated by your model, rather than picking up a kosher (perfect) statistical estimate.
- Your data and your metrics might be poor. Fix this stuff first, even before starting any analysis. If your data has lot’s of noise and errors, using a kosher estimate won’t help. Use compound metrics derived from based metrics, such as IP address category rather than IP address (after you categorized all of them) to boost predictive power.
- Again and again, these rules are violated to get more stable, robust estimates, and the loss due to these violations (as shown below) are negligible. Ignoring these rules also make for estimates that are easier to explain to clients.
- Your rule #1 should not be any of these three rules: instead it should be the maximization of some yield metric, such as user retention, churn, ROI, revenue, savings, number of criminals identified, and so on. You can choose estimates to maximize these metrics.
- Even traditional statistical metrics that measure performance of estimates, such as R-squared, have significant flaws (sensitive to outliers). Instead, I recommend the use of robust metrics such as predictive power or an L^1 version of R-squared.
- In feature selection (aka variable reduction), it is typically impossible to find a global optimum due to the combinatorial nature of the problem. In this case, a local optimum will do very well and can be computed in a fraction of the time. As you explore various parts of the feature space and test a number of feature combinations, you will quickly see how performance improves after each iteration, and stop your “best feature” detection algorithm when performance gains become too small.
- In many cases in big data, there isn’t even a model to start with. See for instance my model-free confidence intervals. In that case, biased / unbiased / minimum variance does not even make sense. Interestingly, my confidence intervals converge (when the number of observations increases) to the traditional statistical confidence intervals, at least on kosher (well-behaved) data.
Some theoretical research should be performed about the maximum yield obtainable with non-kosher estimates.
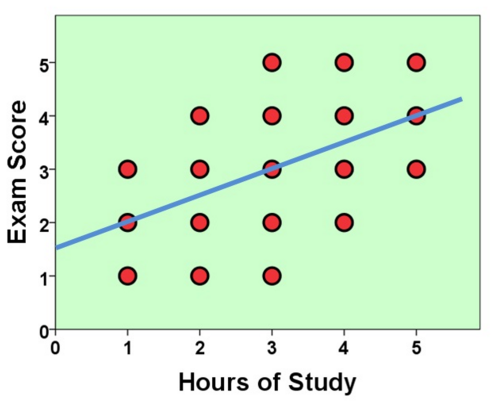
Performance of some non-kosher estimates
This article compares model-free confidence intervals with classic ones. The difference is very small even when the number of observations is as low as 50. In this case, rule #4 is not violated.
In my article on Jackknife regression, you can check that approximate, biased, but robust and easy-to-interpret parameter estimates, yield pretty much the same results as classic estimators, even though they violate all four rules.
Computations comparing the unbiased with the bias-corrected version of the traditional variance estimate show very little differences, even for small samples with 100 observations.
Finally, in the context of local density estimation or clustering based on nearest-neighbors, I used a robust estimate that is a combination of several nearest neighbors, rather than just the k-th nearest neighbor (k-NN). My estimate does not achieve minimum variance (the rule #2), yet it is far more robust: I introduced noise in the data to see how both estimates react to noise – my estimate versus the classic one. Note that my estimate almost achieves minimum variance. The details can be found here.
Related article:
About the Author
Vincent Granville worked for Visa, eBay, Microsoft, Wells Fargo, NBC, a few startups and various organizations, to optimize business problems, boost ROI or to develop ROI attribution models, developing new techniques and systems to leverage modern big data and deliver added value. Vincent owns several patents, published in top scientific journals, raised VC funding, and founded a few startups. Vincent also manages his own self-funded research lab, focusing on simplifying, unifying, modernizing, automating, scaling, and dramatically optimizing statistical techniques. Vincent’s focus is on producing robust, automatable tools, API’s and algorithms that can be used and understood by the layman, and at the same time adapted to modern big, fast-flowing, unstructured data. Vincent is a post-graduate from Cambridge University.
DSC Resources
- Career: Training | Books | Cheat Sheet | Apprenticeship | Certification | Salary Surveys | Jobs
- Knowledge: Research | Competitions | Webinars | Our Book | Members Only | Search DSC
- Buzz: Business News | Announcements | Events | RSS Feeds
- Misc: Top Links | Code Snippets | External Resources | Best Blogs | Subscribe | For Bloggers
Additional Reading
- What statisticians think about data scientists
- Data Science Compared to 16 Analytic Disciplines
- 10 types of data scientists
- 91 job interview questions for data scientists
- 50 Questions to Test True Data Science Knowledge
- 24 Uses of Statistical Modeling
- 21 data science systems used by Amazon to operate its business
- Top 20 Big Data Experts to Follow (Includes Scoring Algorithm)
- 5 Data Science Leaders Share their Predictions for 2016 and Beyond
- 50 Articles about Hadoop and Related Topics
- 10 Modern Statistical Concepts Discovered by Data Scientists
- Top data science keywords on DSC
- 4 easy steps to becoming a data scientist
- 22 tips for better data science
- How to detect spurious correlations, and how to find the real ones
- 17 short tutorials all data scientists should read (and practice)
- High versus low-level data science
Follow us on Twitter: @DataScienceCtrl | @AnalyticBridge