
This article was written by Louis Tiao.
In this series of notebooks, we demonstrate some useful patterns and recipes for visualizing animating optimization algorithms using Matplotlib.
We shall restrict our attention to 3-dimensional problems for right now (i.e. optimizing over only 2 parameters), though what follows can be extended to higher dimensions by plotting all pairs of parameters against each other, effectively projecting the problem to 3-dimensions.
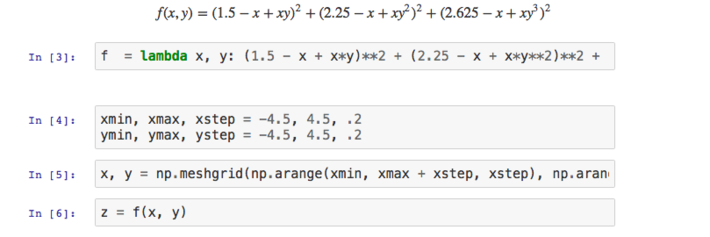
The Wikipedia article on Test functions for optimization has a few functions that are useful for evaluating optimization algorithms. In particular, we shall look at Beale’s function:
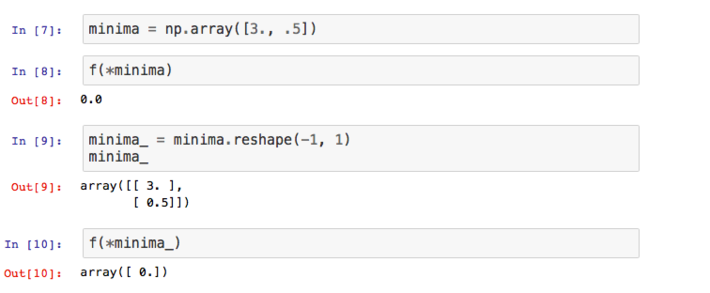
We know the global minima is at (3,0.5)
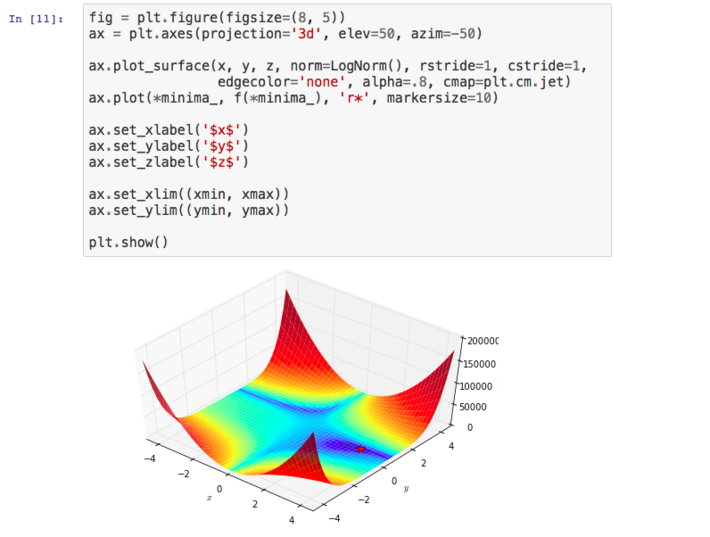
3D Surface Plot
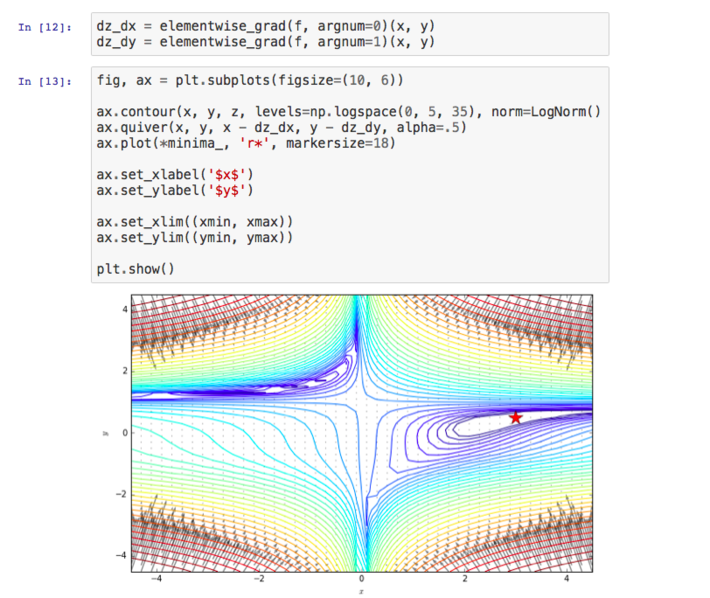
2D Contour Plot and Gradient Vector Field
We use autograd to compute the gradient vector field, and plot it with Matplotlib’s quiver method.
Gradient-based Optimization
For the purposes of this demonstration, we use SciPy’s optimization methods. It goes without saying that the code and patterns for producing these visualizations generalizes easily to other optimization tools and libraries.
We set the starting point as (3,4), since it is challenging for algorithms with a little too much momentum in the gradient descent update rule, as they may overshoot and end up in some local minima.
To read the whole article, with illustrations, click here.