This article was written by Roopam Upadhyay.
This article is a continuation of our manufacturing case study example to forecast tractor sales through time series and ARIMA models. You can find the previous parts at the following links:
Part 1: Introduction to time series modeling & forecasting
Part 2: Time series decomposition to decipher patterns and trends before forecasting
Part 3: Introduction to ARIMA models for forecasting
In this part, we will use plots and graphs to forecast tractor sales for PowerHorse tractors through ARIMA. We will use ARIMA modeling concepts learned in the previous article for our case study example. But before we start our analysis, let’s have a quick discussion on forecasting.
Trouble with Nostradamus
Humans are obsessed about their future – so much so that they worry more about their future than enjoying the present. This is precisely the reason why horoscopists, soothsayers, and fortune tellers are always in high-demand. Michel de Nostredame (a.k.a Nostradamus) was a French soothsayer who lived in the 16th century. In his book Les Propheties (The Prophecies) he made predictions about important events to follow till the end of time. Nostradamus’ followers believe that his predictions are irrevocably accurate about major events including the World Wars and the end of the world. For instance in one of the prophecies in his book, which later became one of his most debated and popular prophesies, he wrote: « Beasts ferocious with hunger will cross the riversthe greater part of the battlefield will be against Hister.Into a cage of iron will the great one be drawn,when the child of Germany observes nothing. »
His followers claim that Hister is an allusion to Adolf Hitler where Nostradamus misspelled Hitler’s name. One of the conspicuous thing about Nostradamus’ prophecies is that he never tagged these events to any date or time period. Detractors of Nostradamus believe that his book is full of cryptic pros (like the one above) and his followers try to force fit events to his writing. To dissuade detractors, one of his avid followers (based on his writing) predicted the month and the year for the end of the world as July 1999 – quite dramatic, isn’t it? Ok so of course nothing earth-shattering happened in that month of 1999 otherwise you would not be reading this article. However, Nostradamus will continue to be a topic of discussion because of the eternal human obsession to predict the future.
Time series modelling and ARIMA forecasting are scientific ways to predict the future. However, you must keep in mind that these scientific techniques are also not immune to force fitting and human biases. On this note let us return to our manufacturing case study example.
ARIMA Model – Manufacturing Case Study Example
Back to our manufacturing case study example where you are helping PowerHorse Tractors with sales forecasting for them to manage their inventories and suppliers. The following sections in this article represent your analysis in the form of a graphic guide.
Now you are ready to start with your analysis to forecast tractors sales for the next 3 years.
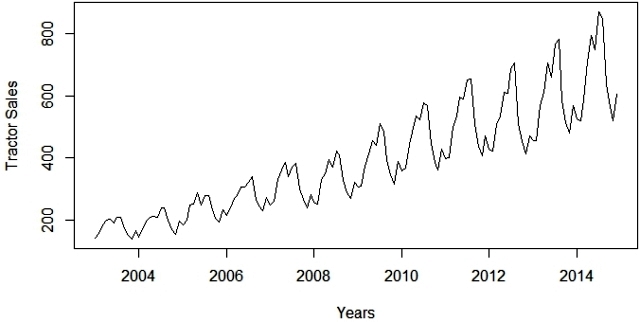
Step 1: Plot tractor sales data as time series
Step 2: Difference data to make data stationary on mean (remove trend)
Step 3: log transform data to make data stationary on variance
Step 4: Difference log transform data to make data stationary on both mean and variance
Step 5: Plot ACF and PACF to identify potential AR and MA model
Step 6: Identification of best fit ARIMA model
Step 7: Forecast sales using the best fit ARIMA model
Step 8: Plot ACF and PACF for residuals of ARIMA model to ensure no more information is left for extraction
To read the whole article, with explanations of each step, click here.

