
Nothing like a devastating catastrophe to bring a bit of reality into the world of IoT and data science. The recent crashes of the new Boeing 737 Max have been attributed to a single point of failure – a sensor – in the design of the complex navigation system[1].
To summarize the situation:
- Boeing’s new 737 MAX included larger, more efficient engines than the previous generation and as such, the engines were placed on a different location on the wings affecting the aerodynamics.
- To compensate for this, and in order to allow pilots to fly these new planes with minimal flight training, Boeing developed software that forced the nose of the plane down in certain circumstances to avoid a stall.
- This software took in data from an “angle of attack” sensor. In the two crashes, this sensor failed leading to an incorrect response by the software to adjust the nose of the plane which the pilots were unable to correct manually.
One of the biggest challenges that data scientists face when developing their analytic models is knowing when “good enough” is actually “good enough”. And this problem is exacerbated by the flood of data (some important, most not important) being generated from IoT sensors.
IoT Dilemma: The Dangers of Sensors Going Wrong
In the rush to exploit the potential of IoT to create “Smart” products and spaces, integrated software and hardware systems are being built with thousands of IoT sensors. For example, the current Airbus A380-1000 model airliner has a total of close to 6,000 sensors across the entire plane and generates 2.5 TB of data per day, while the newer model – expected to take to the skies in 2020 – will capture more than triple that amount[2].
To prevent a single failure point, these complex systems require redundant systems. However, with respect to the Boeing 737 Max, we learn from the New York Times article “F.A.A. Approval of Boeing Jet Involved in Two Crashes Comes Under Scrutiny”:
“The regulators also approved the software to be triggered after receiving data from only one so-called angle-of-attack sensor. The decision allowed for the system to have a single point of potential failure, a rarity in aviation safety.”
I know from first-hand experience the costs associated with a False Negative and a malfunctioning sensor. In my blog “The Sensor That Cried Wolf”, I ended up spending $500 to fix a problem that didn’t actually exist – to replace a sensor that was telling me that my engine was at serious failure, even though the engine was just fine (see Figure 1).

Figure 1: The Sensor that Cried Wolf
Note: I subsequently got rid of that vehicle because I could no longer trust what it was telling me.
As more sensors get added to more vehicles, devices, machinery, and equipment, the probability and impact of the false positives grows exponentially. The interplay between the sensors and any malfunctions (whether sensors wearing out, poorly designed sensors or criminally hacked) dramatically increases the potential of sending out false messages – sensors “crying wolf” about a problem that does not really exist.
The Data Science Dilemma
Here’s the heart of the data science dilemma: when predicting the future, when is “good enough” actually “good enough”? Or framed another way, when is the accuracy and goodness of fit of the analytic model “good enough” to make the decision?
Is 90% accuracy of your analytic model “good enough”?
Well, it depends upon the cost of false positives/negatives. If I’m serving up digital ads and I have a 90% confidence that you are interested in cameras when in reality you are interested in cars, what’s the “cost of being wrong”? Basically, near zero – only the opportunity cost associated with a Pay Per Click (PPC) ad network payment plan (less than a penny). However, if I’m a doctor making a decision on prescribing a particular medicine, then the “cost of being wrong” could be catastrophic (someone dies, and the liability costs could be significant) and a 90% confidence in the accuracy of that model would be insufficient.
In order to understand when “good enough” is actually “good enough”, data scientists can use the cost of false positives/negatives to tell them when the analytic model is “good enough” to make the decision. See the blog “Using Confusion Matrices to Quantify the Cost of Being Wrong” to understand the techniques data scientists can use to understand the costs of False Positives and False Negatives (see Figure 2).
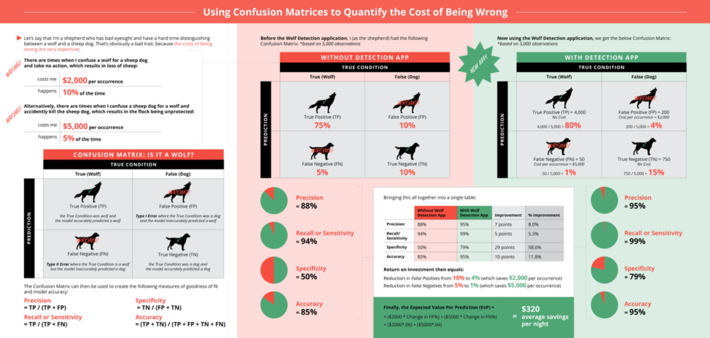
Figure 2: Using Confusion Matrices to Quantify the Cost of Being Wrong
The Data Science Reality of Saddle Points
In the blog “What We Can Learn about AI and Creating Smart Products from The Incredibles“, I introduced the data science challenge of “saddle points”. When trying to use data science to optimize the operations, one must be prepared to jettison their existing analytic models and seek out new models if the current models can’t reach the required confidence level (see Figure 3).
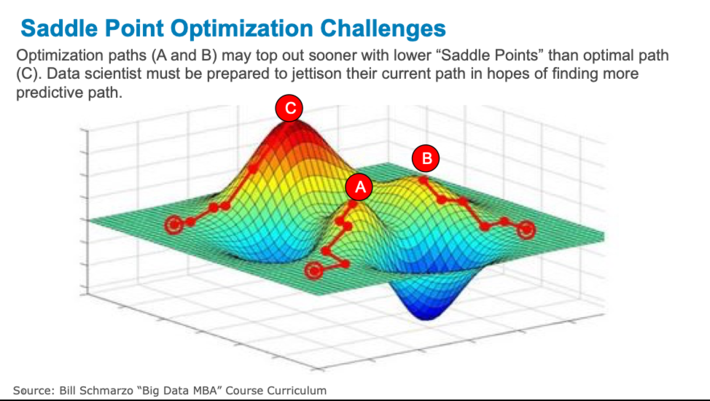
Figure 3: Saddle Point Optimization Challenges
For example, let’s say that for a particular use case, the data science team needs to achieve analytic model accuracy of 92% or better given the costs associated with False Positives and False Negatives. They have completed all of their preparation work (see the Hypothesis Development Canvas) and are now ready to launch into their data science work. They’ve made their analytical assumptions about data, data enrichment, feature engineering, and combinations and sequences of machine learning and deep learning algorithms that they are going to use. And after much effort and tweaking, they realize that no matter how much they continue to tweak the model; they just can’t get above the 85% accuracy represented by point A on Figure 3. The current data science assumptions just top out at Point A.
At this point, the data science team may need a restart and make new analytical assumptions about data, data enrichment, feature engineering, and combinations and sequences of machine learning and deep learning algorithms. And while all the work along Path A won’t be throw away (we learned a lot about the data), the data science team will likely need a fresh restart.
To quote Thomas Edison, “I have not failed. I’ve just found 10,000 ways that won’t work.”
Summary
To help determine when is “good enough” actually “good enough”, put these tools into your data science kit bag:
(1) The Hypothesis Development Canvasis your friend. Invest the time to fully understand the costs of False Positives and False Negatives so they can guide the determination as to when the analytic models are actually “good enough” to support the necessary business and operational decisions (see Figure 4).
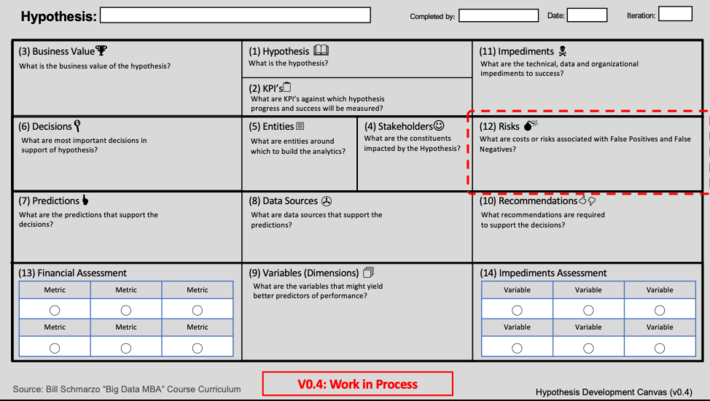
Figure 4: The Hypothesis Development Canvas
(2) Employ a Data Science methodology that supports rapid exploration, rapid discovery, rapid testing, rapid failing and continuous learning in order to achieve the necessary analytic model accuracy levels (see Figure 5).
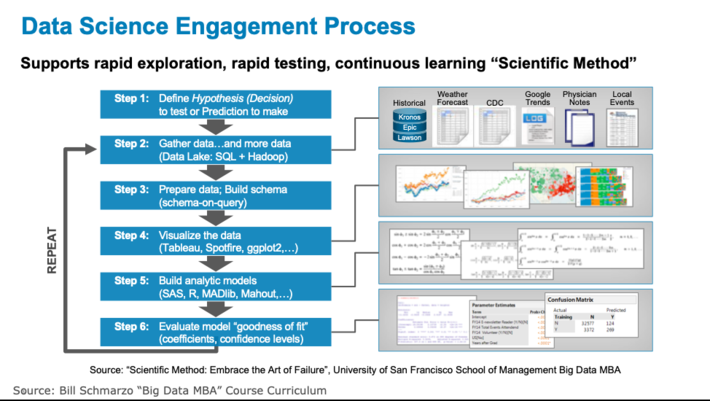
Figure 5: Data Science Engagement Process
And in a world of exploding data volumes and overly-engineered environments and devices driven by IoT, be especially mindful of the costs of False Positives and False Negatives…

Summary of blog key points:
- Internet of Things (IoT) and associated sensors are causing an explosion of operational data.
- Quantifying the costs of false positives and false negatives is becoming critical in hyper-complex IoT environments…and it’s not just relevant for Data Scientists anymore!
- Data Science only knows when “good enough” is actually “good enough” when it fully understands the costs of being wrong (costs associated with False Positives and False Negatives).
- Understanding the data science challenge associated with saddle points.
- Data Science is a non-linear process trying to intersect with highly-linear, highly-engineered business and operational processes – you can’t measure data science progress by lines of code written.
- The Data Science team needs a methodology that supports rapid exploration, rapid discovery, rapid testing, rapid failing and continuous learning.
- The Hypothesis Development Canvas helps to understand the business or operational use case before ever “putting science to the data.”
[1]Bloomberg: “How Boeing’s 737 Max Went From Bestseller to Safety Concern” and Wall Street Journal: “The Risks of Marrying ‘Smart’ Technology With ‘Dumb’ Machines”
[2]That’s Data Science: Airbus Puts 10,000 Sensors in Every Single Wing!