
I was comparing home prices in San Francisco between 1994 and 2018, and I noticed that it has increased by a factor 4 over 25 years. In the meanwhile, the inflation index increased by a factor 1.7 (see here.) I am not saying here that my sources are correct or wrong — entire books have been written on the subject — but instead, my purpose here is to show how some visualizations can be misleading, and how to fix scaling issues, for the human brain to get the “right picture”, even when mathematical correctness tells you otherwise.
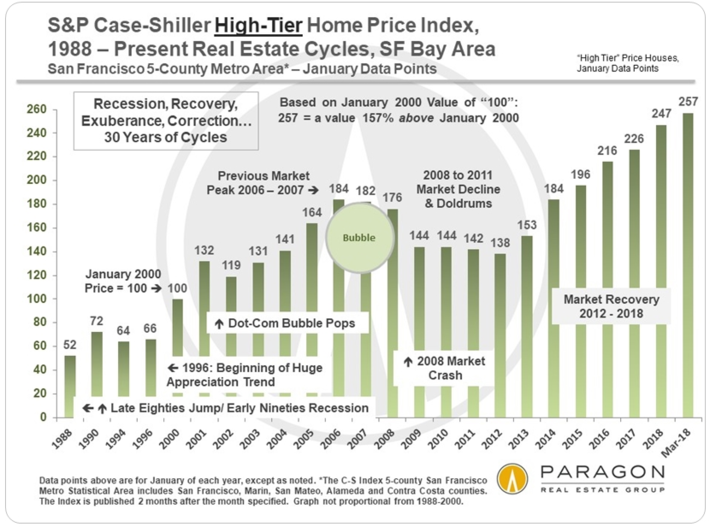 Source for data: see here (this source has lots of other interesting charts)
Imagine that you want to compare the value of a home in 1994, versus 2018, with a nice picture. Figure 1 represents 1994, while figures 2, 3, and 4 represent 2018. Which image, among figures 2, 3, and 4, is correct? (if any) Think about it for a moment, and read my solution below.

Figure 1: Home prices, 1994

Figure 2: Home prices, 2018 (version A)

Figure 3: Home prices, 2018 (version B)

Figure 4: Home prices, 2018 (version C)
From a mathematical point of view, figure 2 is correct, because we are dealing with a 3-D representation: it corresponds to stretching figure 1 by a factor equal to the cubic root of 4. Obviously, it does not convey visually the correct impact of growth, so it is misleading. In figure 3, the stretching factor is 4, but then it appears grossly exaggerated. In figure 2, the stretching factor is equal to the square root of 4, and it seems to be the most realistic representation, because the brain treats the picture as 2-D despite the 3-D structure. After all, it really is a 2-D representation of a 3-D home. My own brain would consider something in-between figure 3 and 4 (but much closer to figure 3) as being the correct representation of a 4-fold increase.
My conclusion is that this type of representation should be avoided. It is quite possible that the perfect stretching factor is different for different people. It would be interesting to ask 10 of your friends what the multiplier is (according to what their brain tells them) in figures 2, 3, and 4. I would imagine the answers will be all over the place.
One could also argue that the home pictured here can not possibly be in San Francisco. It is located (guess where) in Eagle, Idaho, but that is another story.
DSC Resources
- Free Book and Resources for DSC Members
- New Perspectives on Statistical Distributions and Deep Learning
- Deep Analytical Thinking and Data Science Wizardry
- Statistical Concepts Explained in Simple English
- Machine Learning Concepts Explained in One Picture
- Comprehensive Repository of Data Science and ML Resources
- Advanced Machine Learning with Basic Excel
- Difference between ML, Data Science, AI, Deep Learning, and Statistics
- Selected Business Analytics, Data Science and ML articles
- Hire a Data Scientist | Search DSC | Find a Job
- Post a Blog | Forum Questions