

Diving into CDC Behavioral Risk Factor data using Pivot Billions to learn what exercise behaviors are associated with improved health.
Motivating yourself to go outside and get some exercise or play a sport can be hard, but it is worth it. I had trouble with this myself but after looking into the CDC’s Behavioral Risk Factor Surveillance System data from Kaggle I decided to redouble my efforts. The CDC dataset I examined contains over 400,000 individuals’ responses to survey questions for each year from 2011 to 2015 and is an extremely comprehensive dataset containing answers to hundreds of questions regarding the individuals’ behaviors and their resulting health.
However, the size and structure of the data makes it hard to explore. Particularly, the survey schema changes each year and the english meaning of each survey question (and the corresponding answers) are found in a different pdf for each year of the data. I decided to use Pivot Billions to analyze the data since it has useful ETL and data joining features, allowing me to quickly narrow down on the data and survey questions I wanted to explore and discover some of the trends buried within.
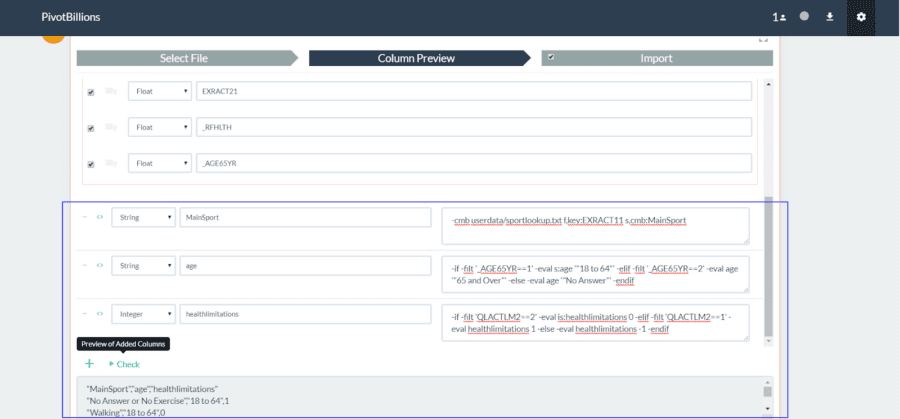
One relationship I wanted to explore was whether various types of physical activity affect a person’s physical, mental, and emotional health before and after retirement. Using Pivot Billions I enhanced the data with three new columns based off of the existing survey questions determining the surveyed persons’ age, main sport over the 30 days prior to the survey, and degree of health limitation. I needed to use a lookup table I’d made to create the MainSport column (matching survey answer to the corresponding activity) so I was grateful that it was easy to combine into my data.
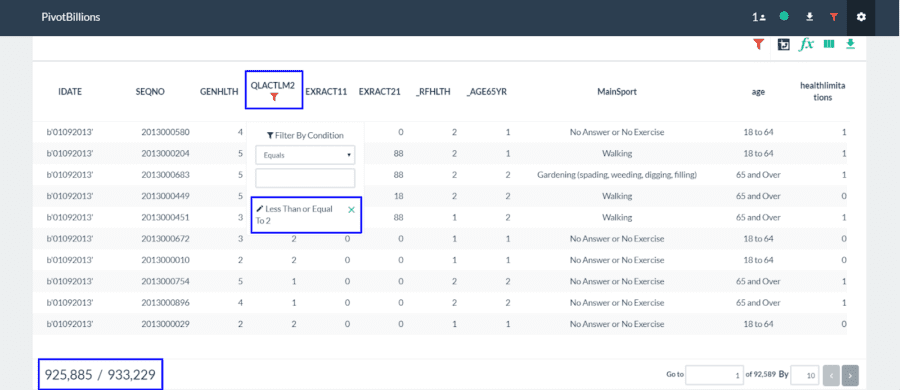
Now that I had a full view of my data along with its enhancements, I quickly filtered the data to eliminate “Refused” and blank answers to the experienced health limitations survey question. This way I had a clear metric for my data: the average degree of experienced physical, mental, or emotional health limitations on a scale from 0 to 1.
My data was now ready for more detailed analysis so I used Pivot Billions’ pivot function to reorganize my data by age category and main sport. Viewing the result as a Bar Graph a picture started to form of what types of activities were associated with better overall health.
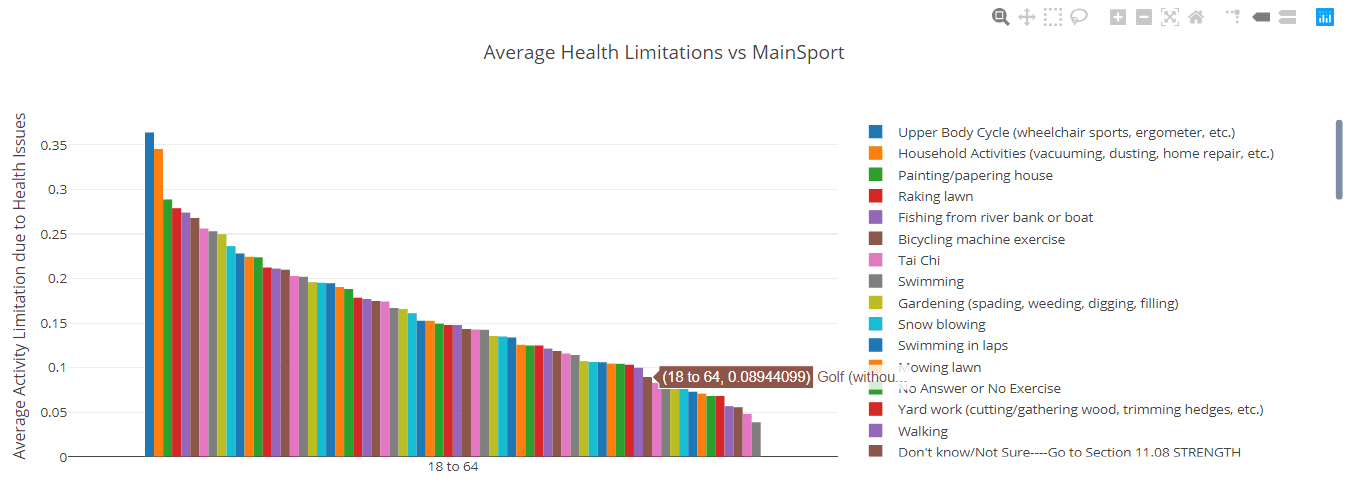
What I noticed first in this visualization is most of the activities associated with worse health for both age groups were activities a person would do in or around the house. I wanted to see how this effect affected each age group so I quickly filtered the pivoted data to the 18 to 64 age group and sorted by decreasing health limitations (increasing overall health).
Sure enough, with a few exceptions such as swimming in laps, the most health limitations were experienced pre-retirement when the individuals exercised or did chores primarily around the house. There was a dramatic improvement in overall health when an individual consistently went outside, even if it was just to play Golf.
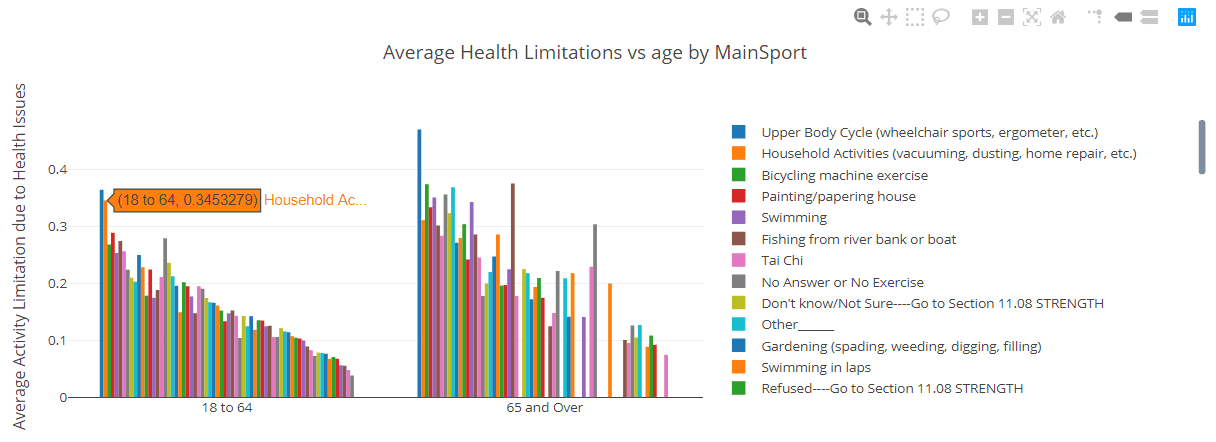
Now, I wanted to see whether there was any effect on the post-retirement age group as well so I quickly re-filtered the pivoted data.
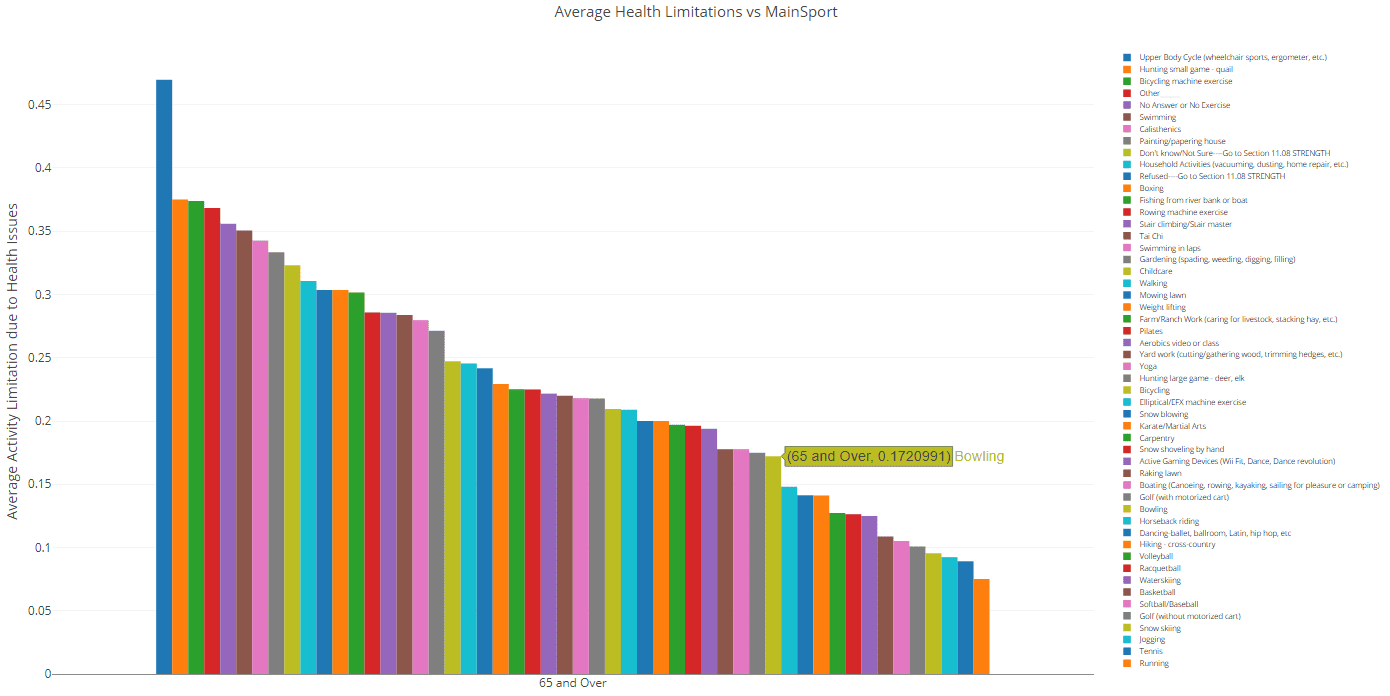
Again we see staying inside of or working around the house associated with a much greater degree of physical, mental, and emotional limitations. In fact getting outside of the house, even to go bowling or golfing, brought an over 40% reduction in experienced limitations for the more than 900,000 people surveyed. It turns out that finding a physical activity that will consistently get you out of the house can help not only your physical fitness, but also dramatically improve your mental and emotional wellbeing.