
This article was written by David Sheehan.
This post describes (with GIFs and words) the most common clustering algorithms available through Scikit-learn.
It’s a common task for a data scientist: you need to generate segments (or clusters- I’ll use the terms interchangably) of the customer base. Where does one start? With definitions, of course!!! Clustering is the subfield of unsupervised learning that aims to partition unlabelled datasets into consistent groups based on some shared unknown characteristics. All the tools you’ll need are in Scikit-Learn, so I’ll leave the code to a minimum. Instead, through the medium of GIFs, this tutorial will describe the most common techniques. If GIFs aren’t your thing (what are you doing on the internet?), then the scikit clustering documentation is quite thorough.
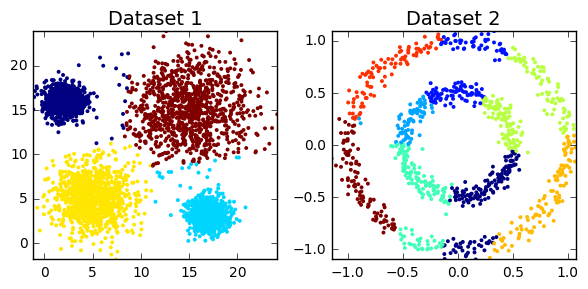
You may be wondering which clustering algorithm is the best. Well, the nature of the data will answer that question. For example, a large dataset could preclude computationally intensive algorithms (e.g hierarchical clustering or affinity propagation). Is anything known about the underlying structure (e.g. globular versus non-globular)? Are you looking for a specific number of clusters? Do you need to illustrate your work with a GIF (I’m looking at you, Affinity Propagation)? So, unfortunately, you need to have various algorithms in your toolbox, ready to deploy as the circumstances dicate (or you could just use k-means for everything).
Table of content
- Techniques
- K-means
- Expectation Maximisation (EM)
- Hierarchical Clustering
- Affinity Propagation (AP)
- DBSCAN
To read the whole article, with each point detailed, click here.
DSC Ressources
- Free Book and Resources for DSC Members
- New Perspectives on Statistical Distributions and Deep Learning
- Deep Analytical Thinking and Data Science Wizardry
- Statistical Concepts Explained in Simple English
- Machine Learning Concepts Explained in One Picture
- Comprehensive Repository of Data Science and ML Resources
- Advanced Machine Learning with Basic Excel
- Difference between ML, Data Science, AI, Deep Learning, and Statistics
- Selected Business Analytics, Data Science and ML articles
- Hire a Data Scientist | Search DSC | Find a Job
- Post a Blog | Forum Questions