
It is more than just a problem, rather a project, possibly even a long-term one for expert data scientists and/or mathematicians, if you want to make a significant contribution towards a great solution. Yet it is also a nice project for beginners, mostly involving exploratory data analysis on the largest data set ever created, using various machine learning techniques, to hone your data science expertise.
The data set contains an infinite number of observations (all the real numbers), though you can start with samples as small as 10,000, or as large as 10 billion. I provide here substantial guidance to help you make great progress on this problem, including sharing my results, conclusions, and spreadsheet with all my computations. Deep theoretical details are omitted, with a reference provided when useful, for the curious. You won’t find this kind of material in any textbook or class.

This problem also allows you to play with concepts such as change point detection in time series, fuzzy clustering, model-fitting using empirical distributions, and even detecting the optimal sample size. My approach towards a solution, discussed throughout this article, relies heavily on data science / machine learning, rather than probability theory.
1. The Problem
It consists of guessing the underlying statistical distribution attached to some sequences of numbers, using various tests and computations. The sequences in question behave like stochastic processes. These sequences are associated with new cryptographic systems. Being able to uncover the hidden distributions, allows you to break the new encryption system described here.
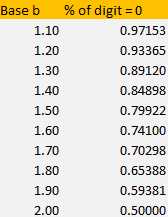
In short, the problem consists of studying the distribution of digits (0’s and 1’s) of random numbers expressed in an unusual numeration system: base b, where b is an integer between 1.5 and 2. The case b = 2 corresponds to the standard binary system, with the distribution in question being uniform. In these bases, the digits — just like in the binary base-2 system — are always 0 or 1. Unlike the binary system though, the proportions of 0’s and 1’s are not equal to 50%, and there is some auto-correlation in the sequence of digits.
Algorithm to compute digits in a non-standard base
To compute the digits of a number x between 0 and 1, in base b, one proceeds as follows:
- Start with x(1) = x and a(1) = INT(bx).
- Iteratively compute x(n) = b * x(n-1) – INT(b * x(n-1)), and a(n) = INT(b * x(n)).
Here INT represents the integer function, also called floor function. The above algorithm is just a version of the greedy algorithm. In all cases, x(n) is a real number between 0 and 1, and a(n) is the n-th digit of x, in base b.
Once the digits in base b are known, it is easy to retrieve the number x, using the formula
Typically, you need to use high performance computing if you want to compute more than 45 digits or so, due to limitations in machine precision. How to do it is described in chapter 8, in my book. However, due to the ergodicity of the sequences { x(n) } and { a(n) }, this is not an issue and you can ignore it (the explanation is beyond the scope of this article; it is explained in my book, for those interested in the theory.)
2. Steps to Solve the Problem
We focus extensively on the sequence of x(n)’s, viewed as a stochastic process or time series X, with x(1) = x being an arbitrary real number between 0 and 1, called the seed. Some seeds (called bad seeds) cause problems, but they are so rare that we can ignore this issue; we will stay away from them anyway. Again, for theoretical details about bad seeds, read my book.
Once the distribution attached to X is known (or at least we have a good approximation), it is straightforward to compute the digit distribution of the number x in base b, that is, the proportion of 0’s and 1’s, and even the auto-correlation structure among successive digits.
All these distributions are independent of the seed x (if x is not a bad seed) and depend only on the base b. Theoretical details are again found in my book (for the curious, check out the book sections discussing the equilibrium distribution.)
Theoretically, you can solve the problem (that is, find the distribution attached to X) by solving the following stochastic integral equation:

I tried, as I did many times (see my book) in similar contexts, but could not find an exact solution here. So instead, let’s focus here on a different, practical approach.
Step 1: X‘s distribution has three legs
Using data science techniques, show that the distribution attached to X has three legs, with two change points p and q, and relies only on b:
- One leg for y between 0 and p,
- One leg for y between p and q,
- One leg for y between q and 1.
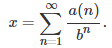
Each leg has a smooth shape as illustrated in the three figures below, but p and q represent discontinuity points for the density function. A non-trivial problem consists of determining p and q, which depend on b. Note that if b = 2 (corresponding to the standard base-2 system) then the three legs merge, and the distribution is uniform on [0, 1], a fact easy to check.
Step 2: Each leg looks like a uniform distribution
Using model fitting techniques applied to the empirical percentile distribution (this is done in our Excel spreadsheet available in the next section) these legs look almost like uniform distributions, but not exactly: there is some curvature, but barely perceptible for most b‘s.
Step 3: A special value of b yields a perfect step-wise uniform distribution
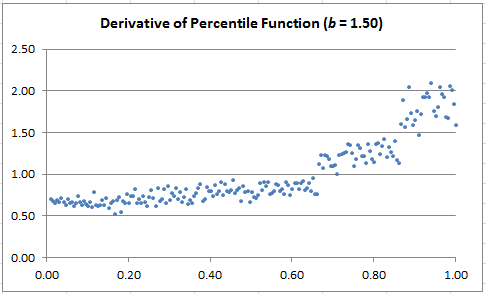
For b close to 1.80, it looks like the distribution might be a combination of three perfectly uniform distributions, as illustrated in the chart below. Which value(s) of b, if any, produces this special case?
Try b = 1.8019 (approximately.) In that case, based on empirical evidence, we approximately have
- p = 1 / b
- P(X < y) = y -1 + 2 / b in the second leg
- The proportion of digits of x that are equal to zero, is -1 + 3 / b ~ 66%.
Exercise: Try also with b = 1.85.
3. Excel Spreadsheet and Results
In order to guess the shape of the distribution of X with great accuracy, you can proceed as follows, for a given x and b:
- Compute the first N = 35,000 values of x(n) and a(n)
- Compute the empirical percentile distribution (denoted as F) for K = 200 equally spaced values of the argument.
- Visually detect the two change points p and q (hint: plot the derivative of F, rather than F, for easier detection — see charts below)
- Try fitting the F curve with a linear regression model, for the three legs separately; display regression parameters and R-squared
- Compute the proportion of digits equal to zero
These computations (and charts) are available and done in my Excel spreadsheet, using basic Excel formulas. Click here for download. An important issue is to determine which sample size (that is, N) you need, as well as which K to use, to get a desired level of accuracy. A rule of thumb is to take K = SQRT(N).
The charts below show the estimated derivative of F. If you join the dots, it will look like time series (they are actually time series.) The dots are left unconnected in other to make the 3-cluster structure (corresponding to the three legs) more visually striking. Note that when the derivative looks flat (the case b = 1.80), it means that the distribution of X is very close to step-wise uniform.
Since it is possible to obtain any level of accuracy by increasing N and K (to determine p, q and so on with great precision, given b), you could use the data displayed in the charts below, as a benchmarking tool for the following:
- Change point detection in time series: when it occurs, and how big the change is
- Detecting the three clusters (they are actually linearly separable even though the boundary looks fuzzy) using some clustering algorithms
Depending on b, it can be easy or difficult. Note that the theoretical percentile distribution (the limiting F as N and K tend to infinity) satisfies

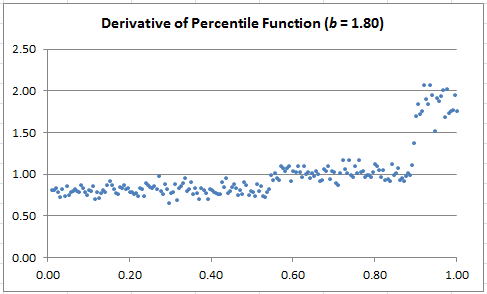
Exercise (reverse engineering): In my spreadsheet (here), look at the tab labeled 1.95. Look at column C in that tab, which contains 35,000 digits of some number x, in base b = 1.95. Let’s pretend that you don’t know the “secret” base, as if you were trying to identify that base. The base typically is the secret key in some encryption scheme. Based solely on the statistical distribution on these digits, can you identify the base?
For related articles from the same author, click here or visit www.VincentGranville.com. Follow me on on LinkedIn.
DSC Resources
- Invitation to Join Data Science Central
- Free Book: Applied Stochastic Processes
- Comprehensive Repository of Data Science and ML Resources
- Advanced Machine Learning with Basic Excel
- Difference between ML, Data Science, AI, Deep Learning, and Statistics
- Selected Business Analytics, Data Science and ML articles
- Hire a Data Scientist | Search DSC | Classifieds | Find a Job
- Post a Blog | Forum Questions