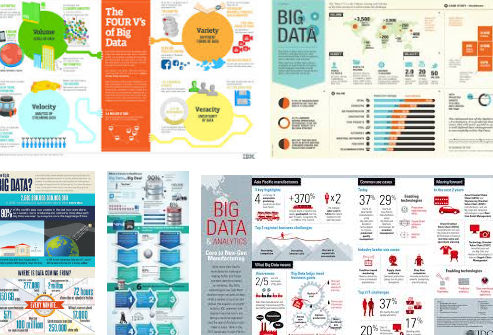
They come in various shapes: infographics, cheat sheets, periodic tables, one-picture articles, and even maps. They cover everything: IoT, AI, machine learning, data science, deep learning, Hadoop, Python, R, dataviz, statistical theory, big data – you name it. Below is a selection that is most relevant to our readers.
This resource is part of a series on specific topics related to data science: regression, clustering, neural networks, deep learning, Hadoop, decision trees, ensembles, correlation, ouliers, regression Python, R, Tensorflow, SVM, data reduction, feature selection, experimental design, time series, cross-validation, model fitting, and many more. To keep receiving these articles, sign up on DSC. Previous entries are listed below the picture.
15 Amazing Infographics and Other Visual Tutorials
- Data Science Summarized in One Picture
- R for Big Data in One Picture
- A Cheat Sheet on Probability
- Data Science in Python: Pandas Cheat Sheet
- Cheat Sheet: Data Visualisation in Python
- Machine Learning Cheat Sheet
- The Periodic Table Of AI
- Three Periodic Tables
- 40 maps that explain the Internet
- A Guide to the Internet of Things
- IoT Tectonics
- 13 Great Data Science Infographics
- Unstructured Data: InfoGraphics
- Great Machine Learning Infographics
- What is Hadoop? Infographics Explains How it Works
Click here to find more infographics.
DSC Resources
- Subscribe to our Newsletter
- Comprehensive Repository of Data Science and ML Resources
- Advanced Machine Learning with Basic Excel
- Difference between ML, Data Science, AI, Deep Learning, and Statistics
- Selected Business Analytics, Data Science and ML articles
- Hire a Data Scientist | Search DSC | Classifieds | Find a Job
- Post a Blog | Forum Questions

