
Summary: If you’re looking for a high growth, high demand area in data science where there is very high value and not many expert practitioners, look at time series forecasting, especially as it applies to Supply Chain Management demand forecasting.
 One of the really fun aspects of being a data scientist is that we are called upon to predict the future. Frequently that means trying to predict who will buy, who will churn, what they will buy next, how much they will spend, all the sorts of questions that are the meat and potatoes of scoring models. But cross over into the realm of predicting the total amount they will buy next month (revenue projection) or the price of certain raw materials needed to fulfill those orders next week, month, or year and now you are in the world of time series forecasting.
Forget all those common warnings “prior performance is no guarantee of the future success”. In fact, if you’ve worked in time series you know that the past can indeed be a good predictor of the future. Maybe not in something as complex as the stock market (though there are a lot of quants making a good living doing just that) but certainly in predicting how many units of product X will be sold at store Y next week, or what the price of commodity Z will be over the next few months, or even the sales by week of a Fortune 1000 company several months into the future.
Time series forecasting is at the heart of corporate financial planning. We need long term revenue and profitability forecasts to guide investment in plant, equipment, and M&A. We need intermediate term forecasts (typically 1 to 3 years) to prepare our tactical response to markets and competitors. But these long and intermediate term forecasts can be presented as fairly smooth curves without fear of too much distortion. The really valuable and difficult forecasts though are the short term forecasts like sales by week for the next three to six months.
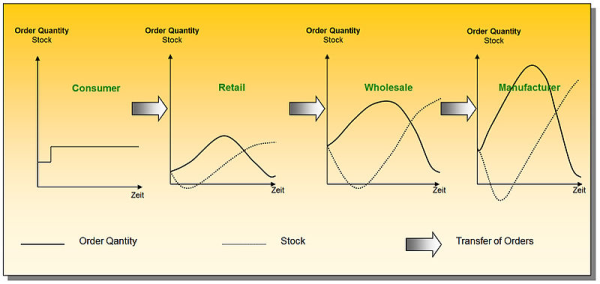
These are typically very irregular and this is the very heart and soul of Supply Chain Management. Guess shipments too high and your inventory carrying costs go up and your gross margin comes down as you discount to move inventory. Guess too low and you’re out of stock, missing the sale altogether. Getting it right is very important. This can result in what’s known as ‘the bullwhip effect’ where small forecasting inaccuracies upstream are magnified with extreme results downstream.
Supposing you don’t know much about time series forecasting and supposing your last 52 weeks of actual demand look like this black band of data.
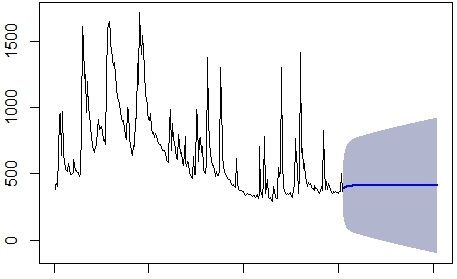 First we would be tempted to cut off all those spikes and discard them as outliers. Then we would probably try to correct for what looks like an annual seasonal pattern. Then we would apply regression or neural nets and the result would be the blue forecast line at right. Your immediate observation should be this:
1. The 95% confidence interval (shaded area) is so large as to make the forecast meaningless.
2. Without accounting for the true periodic spikes in demand and the apparent seasonality, you are setting up your production schedule to fail. It will either be much too high or too low in any future week to meet actual demand (based on history).
And yet this type of forecasting or worse is exactly what exists in most companies today. In a 2014 survey Industry Week found that 77% of companies still used Excel for forecasting. Only 44% used any form of moving average smoothing. More sophisticated techniques like the regression above was used by only 21%, and actual advanced time series techniques were in the single digits and low teens (adds to more than 100% because of multiple techniques within a single company). This year by the way marks the 30th anniversary of the introduction of Excel. Industry has not come a long way in demand forecasting.
Advanced Time Series Forecasting Methods
There are a number of advanced time series forecasting methods that are quite different from those used by data scientists outside of that arena. To name a few of the more common ones (not an exhaustive list):
- Exponential smoothing
- ARIMA and ARIMAX (autoregressive integrated moving average)
- Dynamic regression models
- Vector Autoregression
- Neural network models
- Hierarchical or grouped time series
- Discrete event simulation
- Multi-tiered causal analysis
These are all quite specialized, non-intuitive, and require significant training and experience to produce accurate results. The combination of low adoption and deep required knowledge and experience should flag this as a high opportunity growth area in data science.
An additional difference that sets these apart from the broader area of data science is that while most of the techniques above were developed in an academic environment (as were the predictive and descriptive tools of broader data science) there are some techniques developed by individual companies like SAS that are proprietary and patented. Not surprisingly these are among the most accurate.
Exponential Smoothing and ARIMA/ARIMAX
It’s not our intent to deep dive any of these techniques but a brief description of what these two techniques can do is instructive. Both these techniques are good at irregular cyclic patterns. For example this forecast developed using ARIMA.
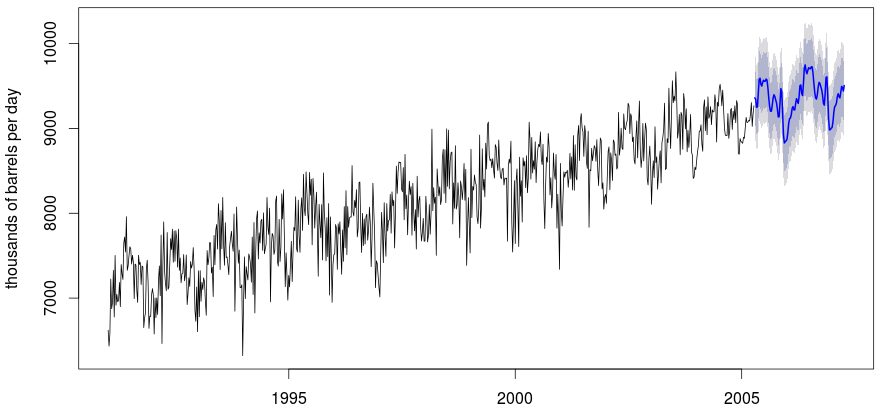 Image source: Rob Hyndman
There are examples of ARIMA models that are accurate at the 98% level against a holdout sample even with this level of complexity.
What is interesting about ARIMA is that it is the combination of two different techniques, univariate autoregression, and moving average. ARIMAX is the same as ARIMA with the addition of a separate time series blended in by transfer function combining essentially three techniques in one. This is sometimes but not always more accurate.
The significance is that the most advanced and accurate methods of time series forecasting are frequently constructed by the blending of multiple techniques, not dissimilar from the concept of team or ensemble modeling.
Why Demand Forecasting Is So Difficult
The real world, especially at the time scale of for example a week shows much more variability. Some of that is random white noise but logically we should have to account for at least the following:
- Trends (growth or decline which may vary in rate over time)
- Seasonality
- Cyclical variation
While these may be the big three obvious drivers of variability AMR Research reports that these account for only 50% of model accuracy. Of far greater impact at the production forecast level are discrete events.
- Weather
- Calendar (holidays, seasonal activities)
- Causal Issues
- Promotions and marketing events (including competitor’s promotions)
- New product introductions
- Price changes
- Macroeconomic effects (e.g. unemployment)
- SKU proliferation
- Change in customer requirements
- Change in customers
Gartner research shows that these external causal issues are the most quoted sources of demand variability among business executives.
Holistic Integrated Forecasting
Consider for example this typical weekly demand history of a manufacturer impacted by seasonality, weather, cyclical demand, sales promotions, and underlying trend.
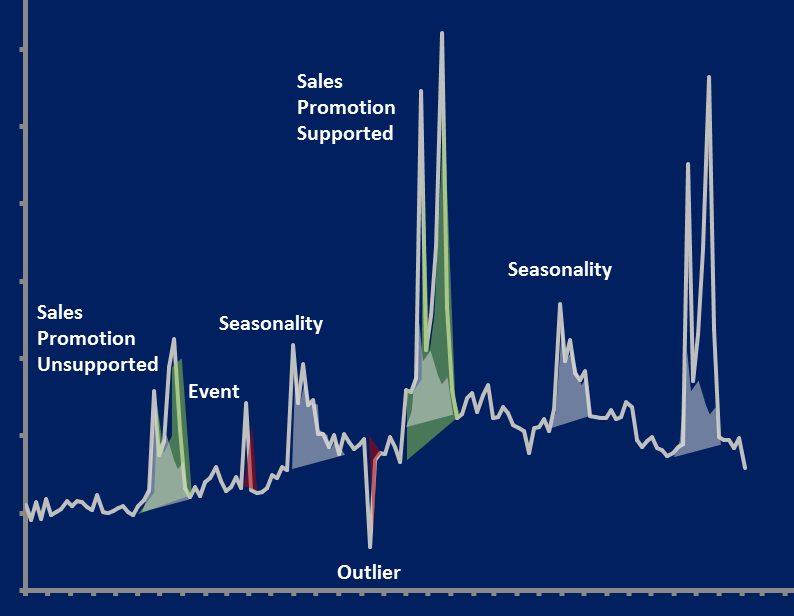 Image source: SAS
The most advanced holistic demand forecasting techniques use multiple techniques, as many as 30 in some instances, to develop champion models and then to combine them into an integrated demand forecast.
Some forecast tool suites are available that can be described as large scale automated forecasting and model generation tools that leverage events and causal variables to create remarkably accurate forecasts of very irregular time series data. See the dotted fit-to-history line and the solid orange forecast line below.
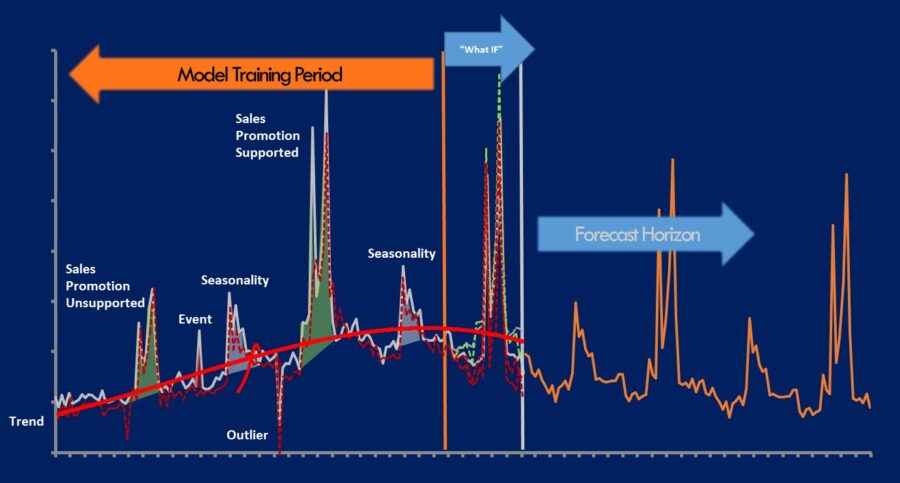 Image source: SAS
The Value Proposition
The value to industry is extremely high.
AMR research reports that using holistic forecasting that accounts for causal events like promotions, weather, and price changes:
- Improves forecast accuracy 54%
- Increases inventory turns 33%
- Results in 15% lower inventories
- Yields a 17% increase in perfect order fulfillment
- Reduces cash-to-cash cycle time 35%.
IndustryWeek’s Supply Chain Insight early this year reported this survey result: Nearly 90% of manufacturers say their revenue would jump by up to 10% if they had better demand forecasts.
This is a highly specialized field within data science. If you want to lay claim to a high value, high growth area, specializing in time series forecasting could be a wise decision.
December 21, 2015
Bill Vorhies
Editorial Director, DSC