
Guest blog by Robert Breen.
What is PowerBI?
Power BI is a collection of software services, apps, and connectors that work together to turn your unrelated sources of data into coherent, visually immersive, and interactive insights. Whether your data is a simple Excel spreadsheet, or a collection of cloud-based and on-premises hybrid data warehouses, Power BI lets you easily connect to your data sources, visualize (or discover) what’s important, and share that with anyone or everyone you want.
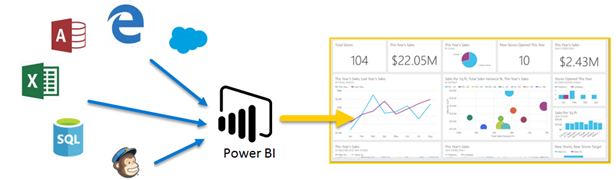
Power BI can be simple and fast – capable of creating quick insights from an Excel spreadsheet or a local database. But Power BI is also robust and enterprise-grade, ready for extensive modeling and real-time analytics, as well as custom development. So, it can be your personal report and visualization tool, and can also serve as the analytics and decision engine behind group projects, divisions, or entire corporations.
What is Power BI Desktop?
Power BI Desktop is a free application you can install on your local computer that lets you connect to, transform, and visualize your data. With Power BI Desktop, you can connect to multiple different sources of data, and combine them (often called modeling) into a data model that lets you build visuals, and collections of visuals you can share as reports, with other people inside your organization. Most users who work on Business Intelligence projects use Power BI Desktop to create reports, and then use the Power BI service to share their reports with others.
The most common uses for Power BI Desktop are the following:
- Connect to data
- Transform and clean that data, to create a data model
- Create visuals, such as charts or graphs, that provide visual representations of the data
- Create reports that are collections of visuals, on one or more report pages
- Share reports with others using the Power BI service
People most often responsible for such tasks are often considered data analysts (sometimes just referred to as analysts) or Business Intelligence professionals (often referred to as report creators). However, many people who don’t consider themselves an analyst or a report creator use Power BI Desktop to create compelling reports, or to pull data from various sources and build data models, which they can share with their coworkers and organizations.
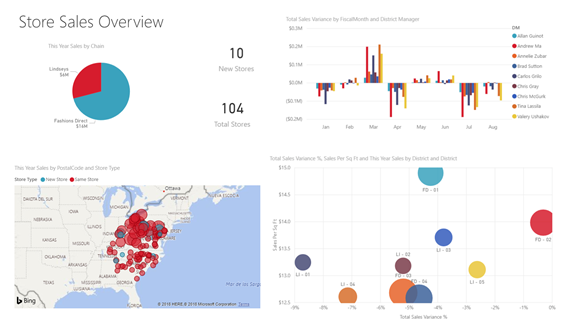
With Power BI Desktop you can create complex and visually rich reports, using data from multiple sources, all in one report that you can share with others in your organization.
The steps you need to follow to install the desktop application are:
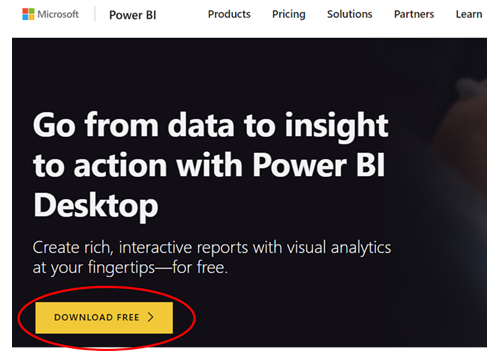
- Go to https://powerbi.microsoft.com/en-us/desktop/ and click on the “Download Free” button:
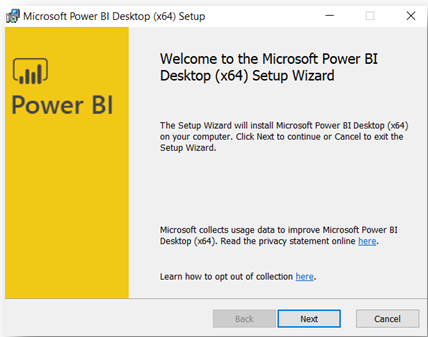
- Once you downloaded the file, open and follow the instructions:
Connect to data
To get started with Power BI Desktop, the first step is to connect to data. There are many different data sources you can connect to from Power BI Desktop. To connect to your data, follow the next steps:
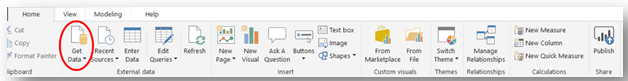
- Select the Home ribbon and then select “Get Data”:
- Then select your data source:
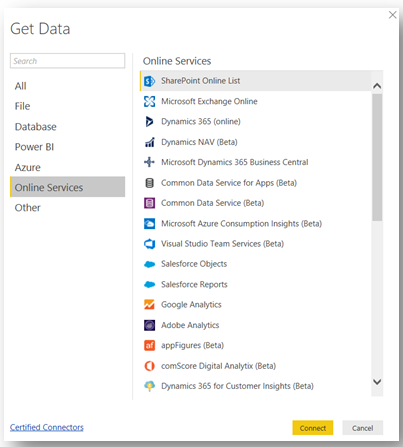
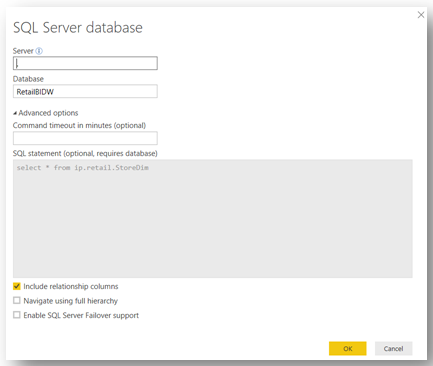
- When you select a data type, you’re prompted for information, such as the URL and credentials, necessary for Power BI Desktop to connect to the data source on your behalf.
Once you connect to one or more data sources, you may want to transform the data so it’s useful for you.
Transform and clean data, create a model
In Power BI Desktop, you can clean and transform data using the built-in Query Editor. With Query Editor you can make changes to your data, such as changing a data type, removing columns, or combining data from multiple sources. It’s a little bit like sculpting – you can start with a large block of clay (or data), then shave pieces off or add others as needed, until the shape of the data is how you want it.
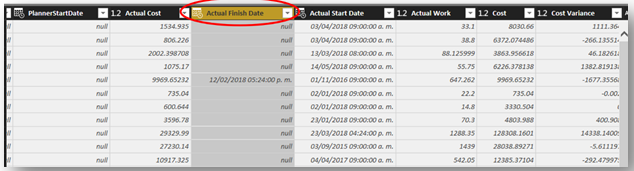
If for example, you want to change the format of one column you need to follow these steps:
- Select the column header:
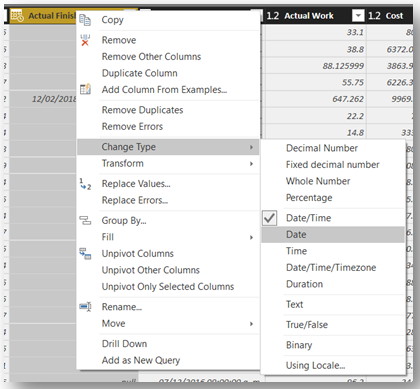
- Right-click to show the menu and select the “Change Type” option and then choose the right option for you:
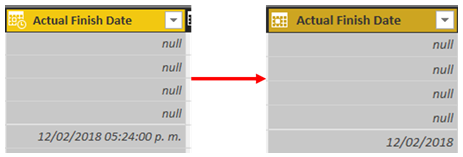
- You’ll see the results:
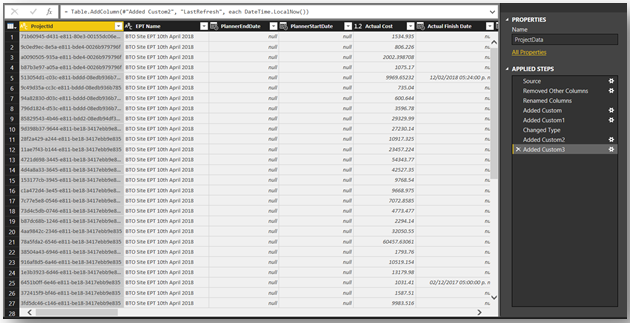
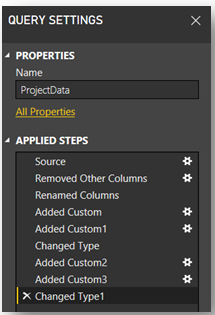
Each step you take in transforming data (such as rename a table, transform a data type, or delete columns) is recorded by Query Editor, and each time this query connects to the data source those steps are carried out so that the data is always shaped the way you specified.
The following image shows the Query Settings pane for a query that has been shaped and turned into a model.
Once your data is how you want it, you can create visuals.
Create visuals
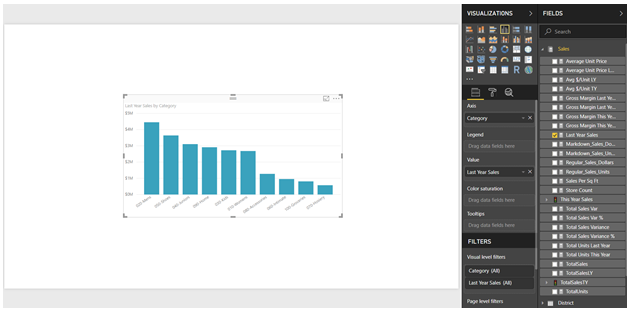
Once you have a data model, you can drag fields onto the report canvas to create visuals. A visual is a graphic representation of the data in your model. The following visual shows a simple column chart.
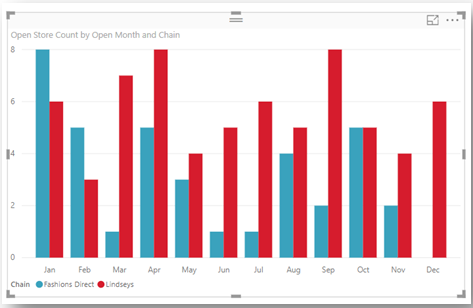
There are many different types of visuals to choose from in Power BI Desktop. To create or change a visual, just select the visual icon from the Visualizations pane. If you have a visual selected on the report canvas, the selected visual changes to the type you selected. If no visual is selected, a new visual is created based on your selection.
To create a new visual, follow the next steps:
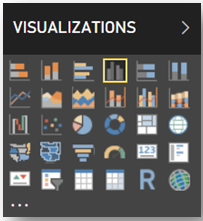
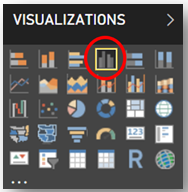
- Choose the appropriate chart from the “Visualizations” pane:
- Drag your data into the “Axis” and “Value” fields:
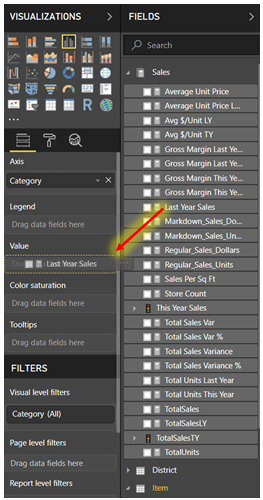
- And you’ll see a chart in your spreadsheet:
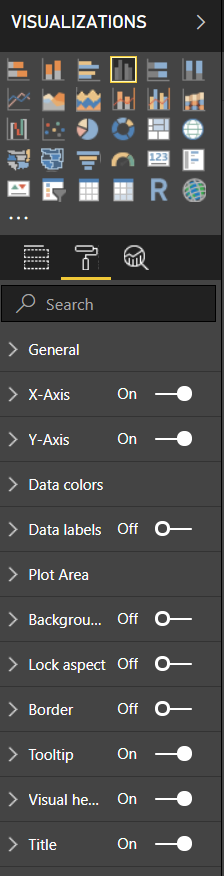
You can customize many of your chart fields and labels in the “Format Pane”:
Learn more at http://www.rhobear.com
DSC Resources
- Free Book: Applied Stochastic Processes
- Comprehensive Repository of Data Science and ML Resources
- Advanced Machine Learning with Basic Excel
- Difference between ML, Data Science, AI, Deep Learning, and Statistics
- Selected Business Analytics, Data Science and ML articles
- Hire a Data Scientist | Search DSC | Classifieds | Find a Job
- Post a Blog | Forum Questions