
This post is a summary of 3 different posts about outlier detection methods.
One of the challenges in data analysis in general and predictive modeling in particular is dealing with outliers. There are many modeling techniques which are resistant to outliers or reduce the impact of them, but still detecting outliers and understanding them can lead to interesting findings. We generally define outliers as samples that are exceptionally far from the mainstream of data.There is no rigid mathematical definition of what constitutes an outlier; determining whether or not an observation is an outlier is ultimately a subjective exercise.
There are several approaches for detecting Outliers. Charu Aggarwal in his book Outlier Analysis classifies Outlier detection models in following groups:
- Extreme Value Analysis: This is the most basic form of outlier detection and only good for 1-dimension data. In these types of analysis, it is assumed that values which are too large or too small are outliers. Z-test and Student’s t-test are examples of these statistical methods. These are good heuristics for initial analysis of data but they don’t have much value in multivariate settings. They can be used as final steps for interpreting outputs of other outlier detection methods.
- Probabilistic and Statistical Models: These models assume specific distributions for data. Then using the expectation-maximization(EM) methods they estimate the parameters of the model. Finally, they calculate probability of membership of each data point to calculated distribution. The points with low probability of membership are marked as outliers.
- Linear Models: These methods model the data into a lower dimensional sub-spaces with the use of linear correlations. Then the distance of each data point to plane that fits the sub-space is being calculated. This distance is used to find outliers. PCA(Principal Component Analysis) is an example of linear models for anomaly detection.
- Proximity-based Models: The idea with these methods is to model outliers as points which are isolated from rest of observations. Cluster analysis, density based analysis and nearest neighborhood are main approaches of this kind.
- Information Theoretic Models: The idea of these methods is the fact that outliers increase the minimum code length to describe a data set.
- High-Dimensional Outlier Detection: Specifc methods to handle high dimensional sparse data
In this post we briefly discuss proximity based methods and High-Dimensional Outlier detection methods.
Proximity Based Methods
Proximity based methods can be classified in 3 categories: 1) Cluster based methods 2)Distance based methods 3) Density based methods
Cluster based methods classify data to different clusters and count points which are not members of any of known clusters as outliers. Distance based methods in the other hand are more granular and use the distance between individual points to find outliers.
Local Outlier Factor method is discussed here using density based methods. Distance based approaches will have problem finding an outlier like point O2. Because the points in cluster C1 are less dense compare to cluster C2. If we chose a large threshold to capture an outlier like O2, many of the points in C1 will be counted as outliers.
Cluster based approaches have similar problems. Because they only consider the distance between point and centroid of cluster to calculate outlier score. The density based approaches and specially LOF approach discussed here are sensitive to densities and those approaches are more appropriate for calculating local outliers.
Below are main steps for calculating outlier score using LOF:
- First we find the K-nearest neighbors of each point in dataset. Selecting the right K has been discussed in the paper
- We call the max distance to K-nearest points that we found in previous step K-distance. For example, for the first point if used K=3 and found the 3 nearest neighbors have distances of 1.2, 2.5 and 6.4 the k-distance for this point will be 6.4.
- Next, for certain number of points (MinPts) we calculate the reach-distance:

4.Then we calculate the local reachability density of each point using below formula:

5. Finally, we calculate LOF Scores using below formula:
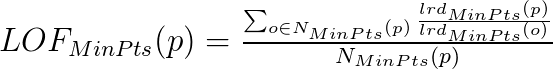
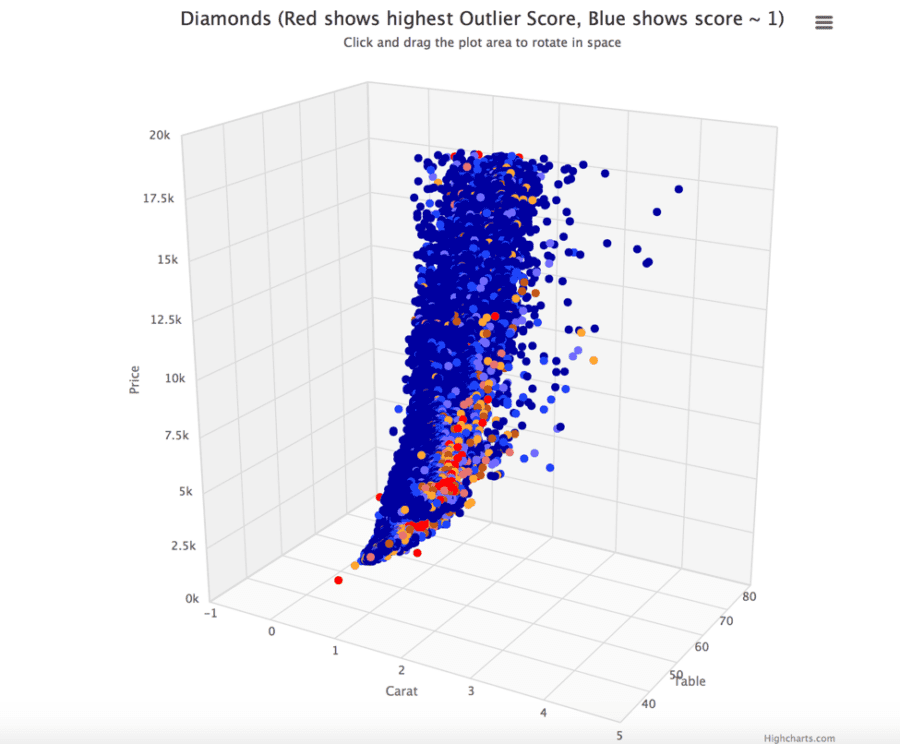
The LOF score generated for regular points will be close to 1. The score for outliers will be far from 1.
High Dimensional Outlier Detection
Many real world data sets are very high dimensional. In many applications, data sets may contain hundreds or thousands of features. In those scenarios because of well known curse of dimensionality the traditional outlier detection approaches such as PCA and LOF will not be effective. High Contrast Subspaces for Density-Based Outlier Ranking (HiCS) method explained in this paper as an effective method to find outliers in high dimensional data sets.
LOF method discussed in previous section uses all features available in data set to calculate the nearest neighborhood of each data point, the density of each cluster and finally outlier score for each data point.
There is a detailed proof available in this paper that shows that as dimensionality increases, the distance to the nearest neighbor approaches the distance to the farthest neighbor.In other word, contrast in distances to different data points becomes nonexistent. This basically means using methods such as LOF, which are based on nearest neighborhood, for high dimensional data sets will lead to outlier scores which are close to each other.
The HiCS method basically uses the following steps to deal with curse of dimensionality in outlier detection problem:
- First it finds High Contrast subspaces using comparison of marginal pdf and conditional pdf for each subspace
- Next it calculates outlier score for each point based on each of high contrast subspaces
- Finally it calculates the average of scores generated from previous step