
 Grafana is an open-source, nightly built dashboarding, analytics, and monitoring platform that is tinkered for connection with a variety of sources like Elasticsearch, Influxdb, Graphite, Prometheus, AWS Cloud Watch, and many others.
One of the biggest highlights of Grafana is the ability to bring several data sources together in one dashboard with adding rows that will host individual panels (each with visual type).
Among the other pros are:
- Nice design of the visuals and interface;
- Comfortable to work on several sources;
- Easy to connect to the sources.
However, Grafana also has some cons:
- It takes a bit of time to figure out where filters go and how to compose certain visuals;
- Some of the stuff is abstracted away unnecessarily – there is no way to send raw queries to the data source from Grafana;
- Plugin installation – default install has only a few visual types, and you will most likely end up installing plugins (even for pie chart). Grafana may have few problems during installing plugins, which are not easy to debug.
Installing Grafana on centos Linux and its sisters
First, add rpm repo:
sudo cat > /etc/yum.repos.d/grafana.repo - repoconf[grafana]name=grafana baseurl=https://packagecloud.io/grafana/stable/el/6/$basearch
 repo_gpgcheck=1
 enabled=1
 gpgcheck=1
 gpgkey=https://packagecloud.io/gpg.key https://grafanarel.s3.amazonaws.com/RPM-GPG-KEY-grafana
 sslverify=1
 sslcacert=/etc/pki/tls/certs/ca-bundle.crt
 repoconf
Then, install using yum:
sudo yum install grafana
Installing via repo adds system unit for running in daemon mode.
To run as daemon, do the following:
systemctl daemon-reloadsystemctl start grafana-serversystemctl status grafana-server
If you want to enable auto-startup on the boot, run:
sudo systemctl enable grafana-server.service
Configuration
All defaults for running are configured in environment variables in /etc/sysconfig/grafana-server:
GRAFANA_USER=grafanaGRAFANA_GROUP=grafanaGRAFANA_HOME=/usr/share/grafana LOG_DIR=/var/log/grafana
 DATA_DIR=/var/lib/grafana
 MAX_OPEN_FILES=10000
 CONF_DIR=/etc/grafana
 CONF_FILE=/etc/grafana/grafana.ini
 RESTART_ON_UPGRADE=true
 PLUGINS_DIR=/var/lib/grafana/plugins
As to Grafana configurations, everything is listed (including defaults) in /etc/grafana/grafana.ini.
If you want to access Grafana from outside (not localhost only) set http_addr config to bind to all interfaces explicitly or leave it blank to do the same thing implicitly.
If Grafana is still inaccessible, make sure that the firewall does not block traffic on Grafana’s port.
To add a port to allowed, use:
GRAFANA_USER=grafanafirewall-cmd --zone=public --add-port=3000/tcp --permanentfirewall-cmd --reload
Then, check it in:
iptables-save | grep 3000
Installing plugins
Installation of plugins may cause several troubles due to incompatibilities of Grafana versions. The most common problem is that the plugin is installed but not detected and thus not usable. To avoid such situation, it is better to follow the next steps to install a plugin.
First, make sure that `/var/lib/grafana/` folder is owned by Grafana user and has all permissions. If not, then run:
sudo chown -R grafana /var/lib/grafana/sudo chmod -R 700 /var/lib/grafana/
Stop Grafana:
systemctl stop grafana-server
Make sure to clear cache in the browser, from which you access Grafana.
Then, install a plugin using the cli utility:
grafana-cli plugins install
Check that your plugin installed successfully:
grafana-cli plugins ls
After that, start Grafana up again:
systemctl stop grafana-server
Check your installation in a browser.
Beginning to work
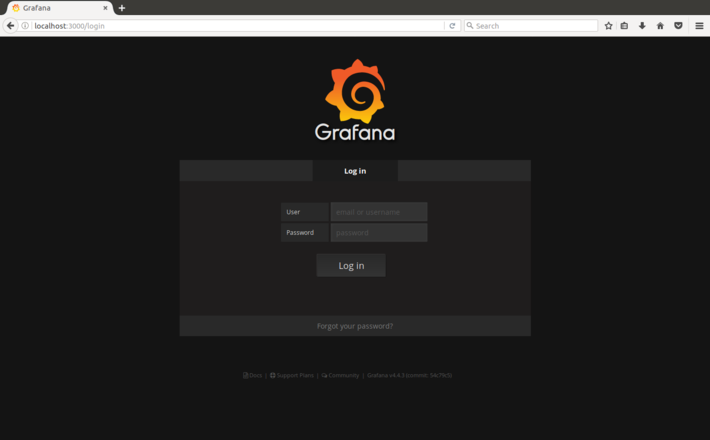
First, you will need to log in. By default, Grafana creates an admin user with admin password on startup (maybe changed in /etc/grafana/grafana.ini).
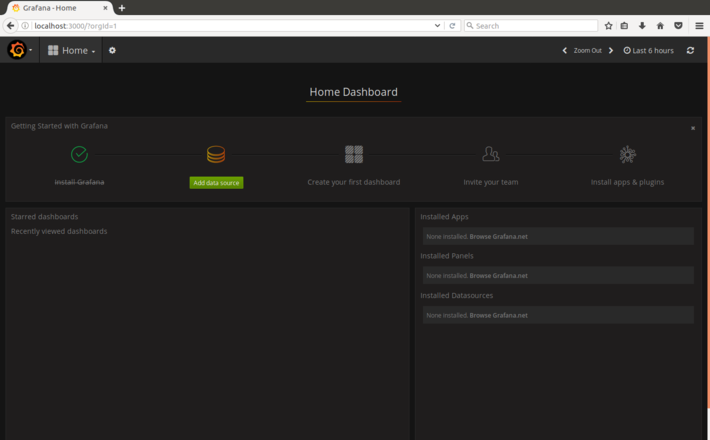
As you log in, you will be prompted to connect to your first data source.
We will connect to an instance of the elasticsearch cluster:
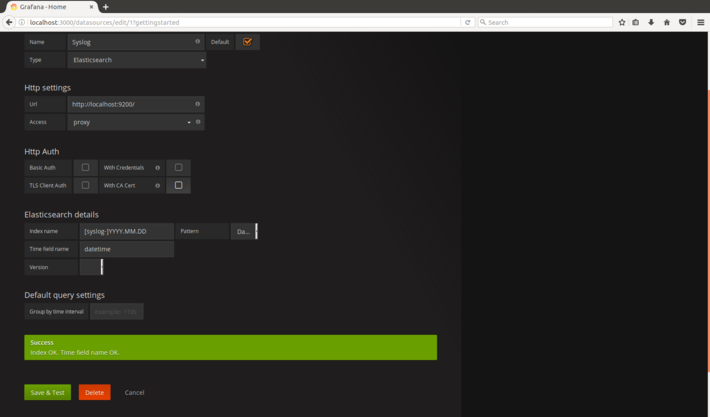
Just fill all the fields to connect to the cluster. Note that in place of the index name you may specify the pattern for lookup.
Then you may proceed to create the dashboard.
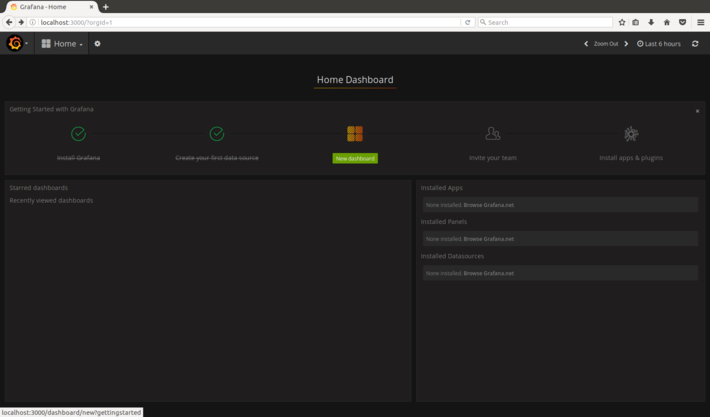
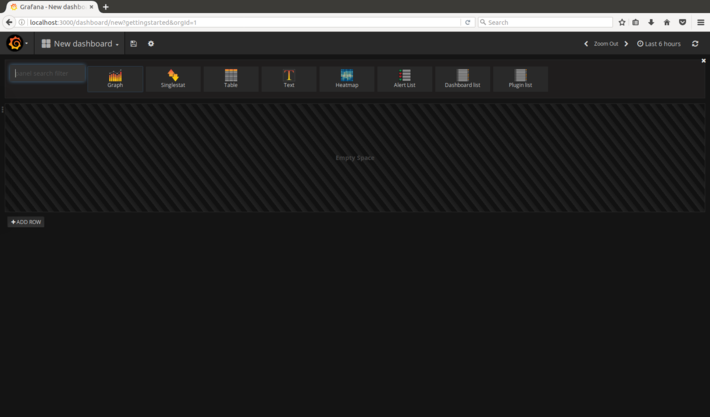
You will end up with an empty dashboard with one row. In that row you can put any panels you want – each panel is responsible for one visual.
Choose the type of panel and explore the ways to interact with it. Important note: in the upper left corner you must choose the time interval for which the data will be used and displayed (in our case we set up the time field to be the one from data itself; you may use logstash @timestamp or anything you wish).
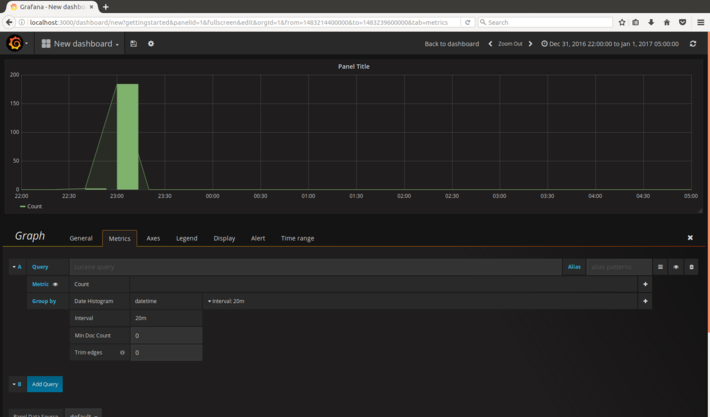
The tabs of the Graph are grouping the settings logically so they are easy to discover. The way data is queried for building visual is all mirrored in Metrics tab. The way the visual looks is set in Display tab. Save the dashboard by clicking diskette sign on the top and giving it concise name. That is it. Build cool dashboards fast.
Conclusion
In this article we highlighted key pros and cons of Grafana. We have also given a brief and simple instruction on Grafana installation and starting operation. Follow these simple steps and get the benefits of Grafana application. Build engagement and appealing dashboards to make your data easy for comprehension in a few clicks.