
Introduction
One of the major reasons organizations migrate to the AWS cloud is to gain the elasticity that can grow and shrink on demand, allowing them to pay only for resources they use. But the freedom to provide on-demand resources can sometimes lead to very high costs if they aren’t carefully monitored. Cost Optimization is one of the five pillars of the AWS Well-Architected Framework, and with good reason. When you optimize your costs, you build a more efficient cloud that helps focus your cloud spend where it’s needed most while freeing up resources to invest in things like more headcount, innovative projects or developing competitive differentiators.
Additionally, considering the cost implementation in mind, we will try to optimise our own cost of AWS usage by visualising it with AWS Quicksight. We will look into the complete setup of viewing the AWS cost and usage reports. Furthermore, we will look to implement our goal using S3 and Athena.
What is AWS Cost and Usage Service?
The AWS Cost and Usage report tracks your AWS usage and provides estimated charges associated with your AWS account. The report contains line items for each unique combination of AWS product, usage type, and operation that your AWS account uses. You can customize the AWS Cost and Usage report to aggregate the information either by the hour or by the day. AWS delivers the report files to an Amazon S3 bucket that you specify in your account and updates the report up to three times a day. You can also call the AWS Billing and Cost Management API Reference to create, retrieve, or delete your reports. You can download the report from the Amazon S3 console, upload the report into Amazon Redshift or Amazon QuickSight, or query the report in Amazon S3 using Amazon Athena.
What is AWS QuickSight?
Amazon QuickSight is an Amazon Web Services utility that allows a company to create and analyze visualizations of its customers’ data. The business intelligence service uses AWS’ Super-fast, Parallel, In-memory Calculation Engine (SPICE) to quickly perform data calculations and create graphs. Amazon QuickSight reads data from AWS storage services to provide ad-hoc exploration and analysis in minutes. Amazon QuickSight collects and formats data, moves it to SPICE and visualizes it. By quickly visualizing data, QuickSight removes the need for AWS customers to perform manual Extract, Transform, and Load operations.
Amazon QuickSight pulls and reads data from Amazon Aurora, Amazon Redshift, Amazon Relational Database Service, Amazon Simple Storage Service (S3), Amazon DynamoDB, Amazon Elastic MapReduce and Amazon Kinesis. The service also integrates with on-premises databases, file uploads and API-based data sources, such as Salesforce. QuickSight allows an end user to upload incremental data in a file or an S3 bucket. The service can also transform unstructured data using a Prepare Data option
What is AWS Athena?
Amazon Athena is an interactive query service that makes it easy to analyze data in Amazon S3 using standard SQL. Athena is serverless, so there is no infrastructure to manage, and you pay only for the queries that you run. Athena is easy to use. Simply point to your data in Amazon S3, define the schema, and start querying using standard SQL. Most results are delivered within seconds. With Athena, there’s no need for complex ETL jobs to prepare your data for analysis. This makes it easy for anyone with SQL skills to quickly analyze large-scale datasets.
Athena is out-of-the-box integrated with AWS Glue Data Catalog, allowing you to create a unified metadata repository across various services, crawl data sources to discover schemas and populate your Catalog with new and modified table and partition definitions, and maintain schema versioning. You can also use Glue’s fully-managed ETL capabilities to transform data or convert it into columnar formats to optimize cost and improve performance.
Setting up AWS S3 and Cost Service
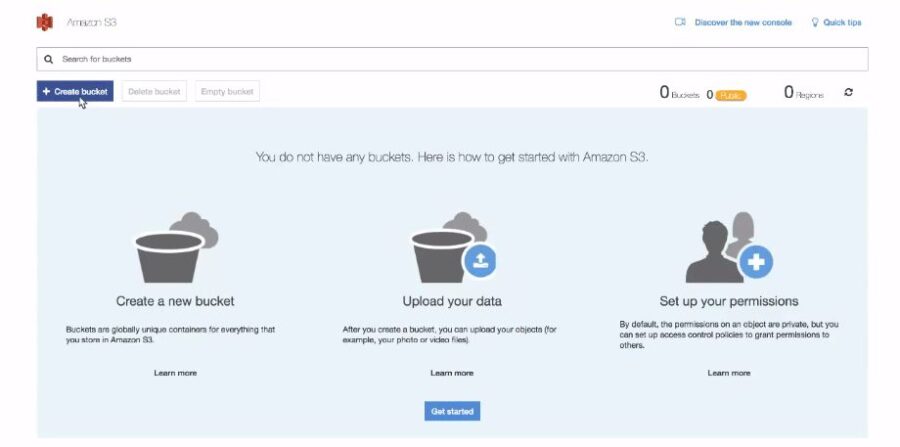
The very first task requires you to set up an S3 bucket. S3 bucket is the location where we will be putting our amazon cost and usage data. Go to your Amazon console and select S3. Click on create bucket button to initialise the setup
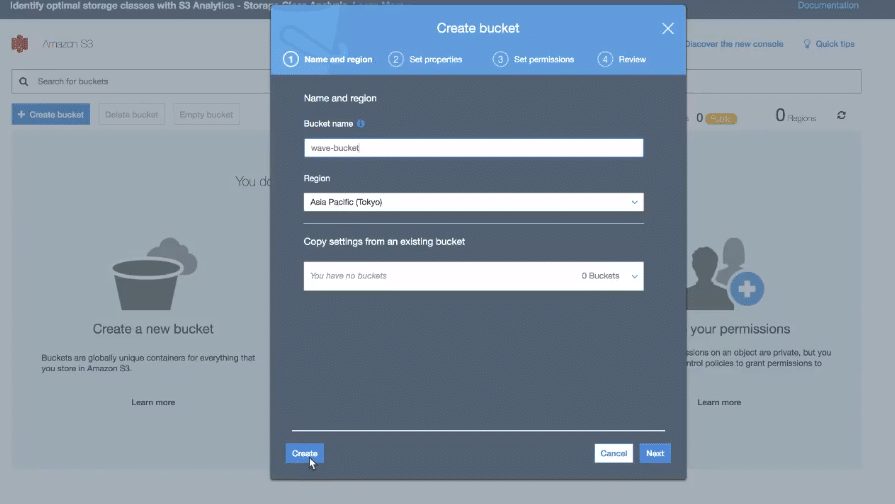
Once the create bucket menu pops up, you will see the different options to fill. You need to write the bucket name, mention region and select access settings for the bucket in this step.
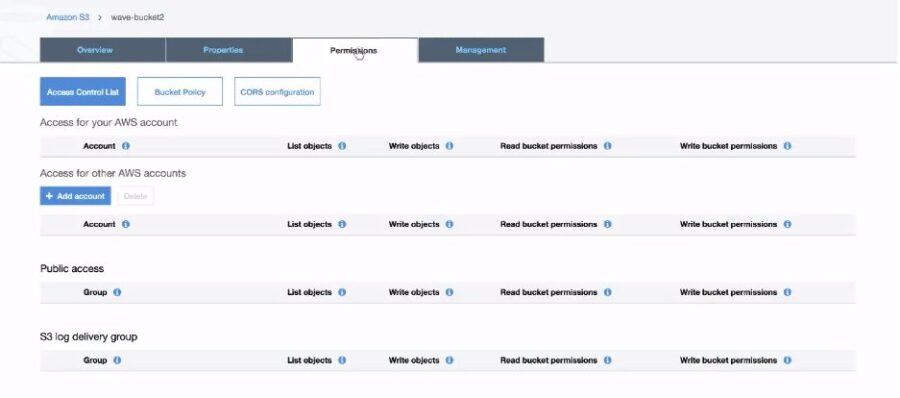
Click on create after filling all the fields. Open S3 and navigate to the Permissions tab in the console. We need to copy the access policy from here to access this bucket from quicksight. Furthermore, this policy will help in connecting the bucket with AWS cost and usage service.
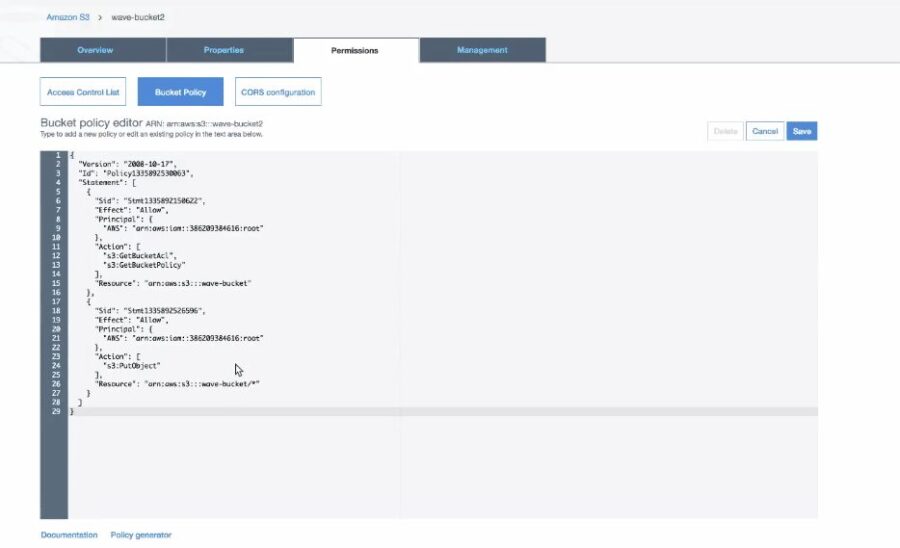
Click on bucket policy. A JSON file will come up with some default settings. We do not need to change much of the things in this file. You can directly copy the code their
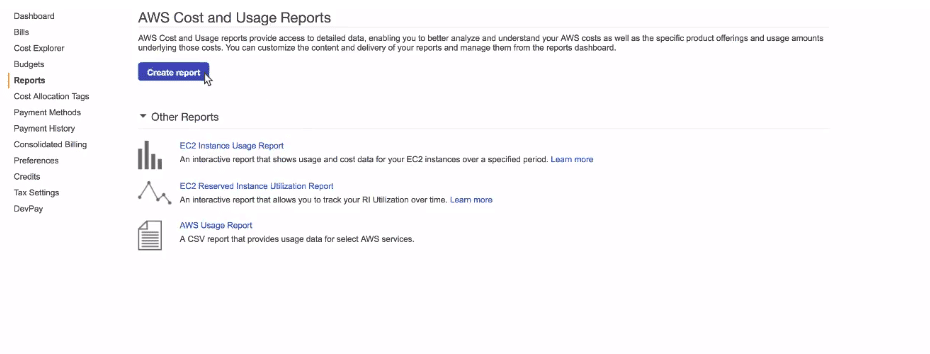
We are able to set up our S3 bucket till now. Additionally, we need to create our cost and usage report now. Go to AWS Cost and usage reports tab from the console. Click on create the report to create a new report on cost and usage.
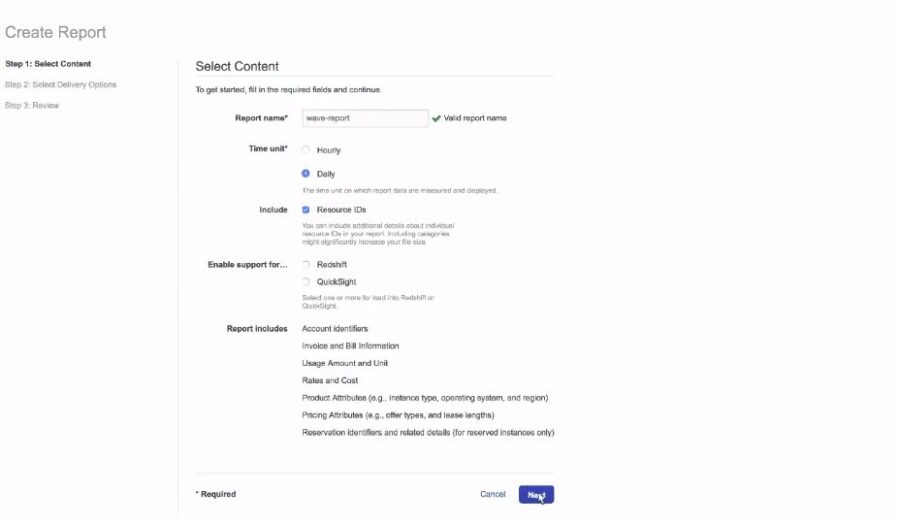
After clicking on create report, a form will pop up. Mention all the necessary details here. The form includes the report name, cost and usage time level. You can directly access these reports for Redshift and Quicksight. In this tutorial, we are storing the data in the S3 bucket first. After storing it in S3 bucker, we will connect it with AWS Quicksight.
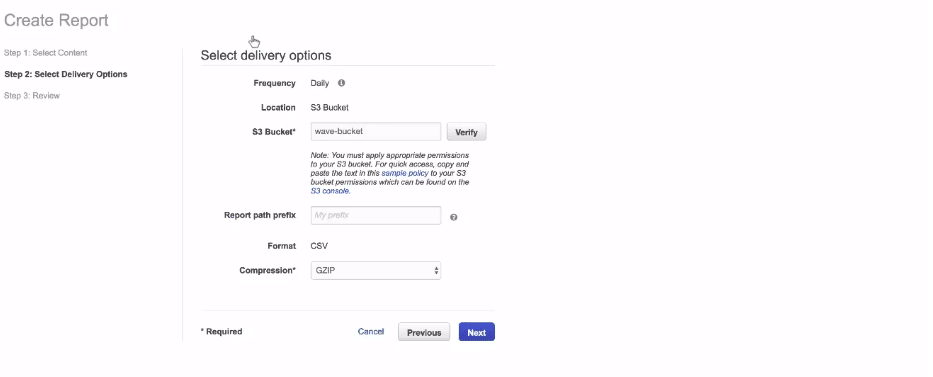
In the second part, we need to select a delivery option. I will mention the name of the final delivery S3 bucket which we created in the previous step.
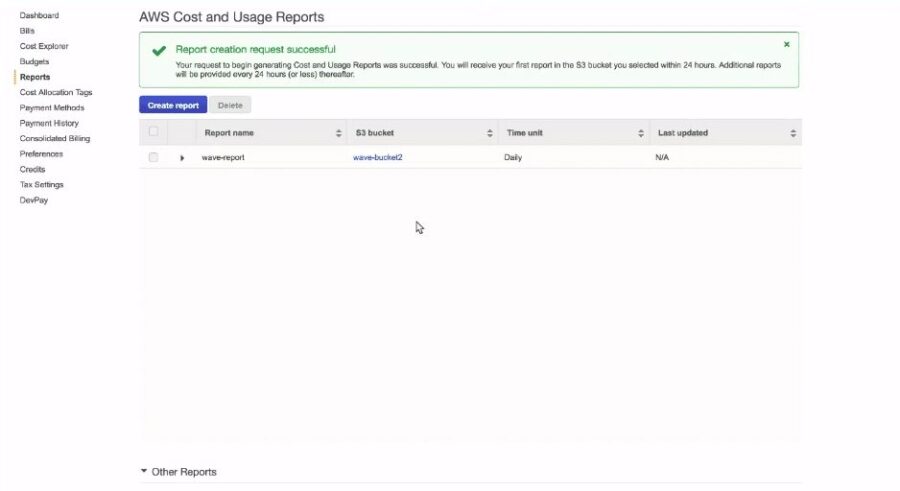
Fill the form and click next. After clicking the next, we have created a report on AWS cost and billing. Click on the newly generated report now.
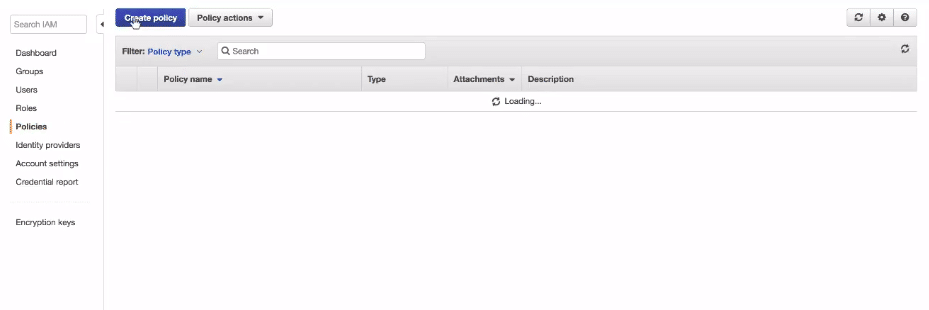
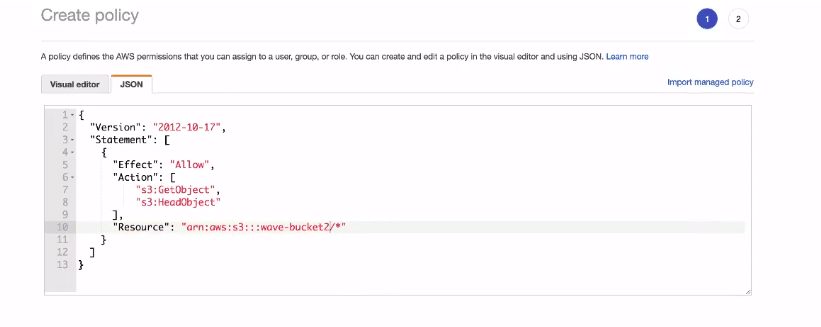
We need to set up access policies for the report. Click on create a new policy and sample editor will pop up
You can choose to edit the policy depending upon your requirement. Edit the resource section here and mention the correct name of your S3 bucket here. Click on done to complete the policy initialisation
Congratulations! Till this part, we have done most of our work. We have an S3 bucket to store cost and usage data. Also, we have set up cost and usage reports to access our S3 bucket and store the results there.
Setting up Athena (Cloud formation template) and Running Queries
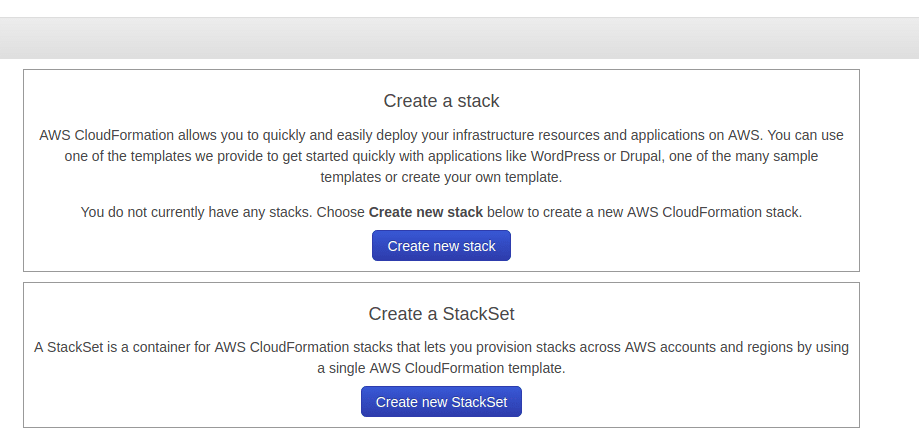
Now we need to setup Athena using a cloud formation template. Go to cloud formation console and click on select “Create New Stack”. Once you click on create a new stack, a sample popup will come.
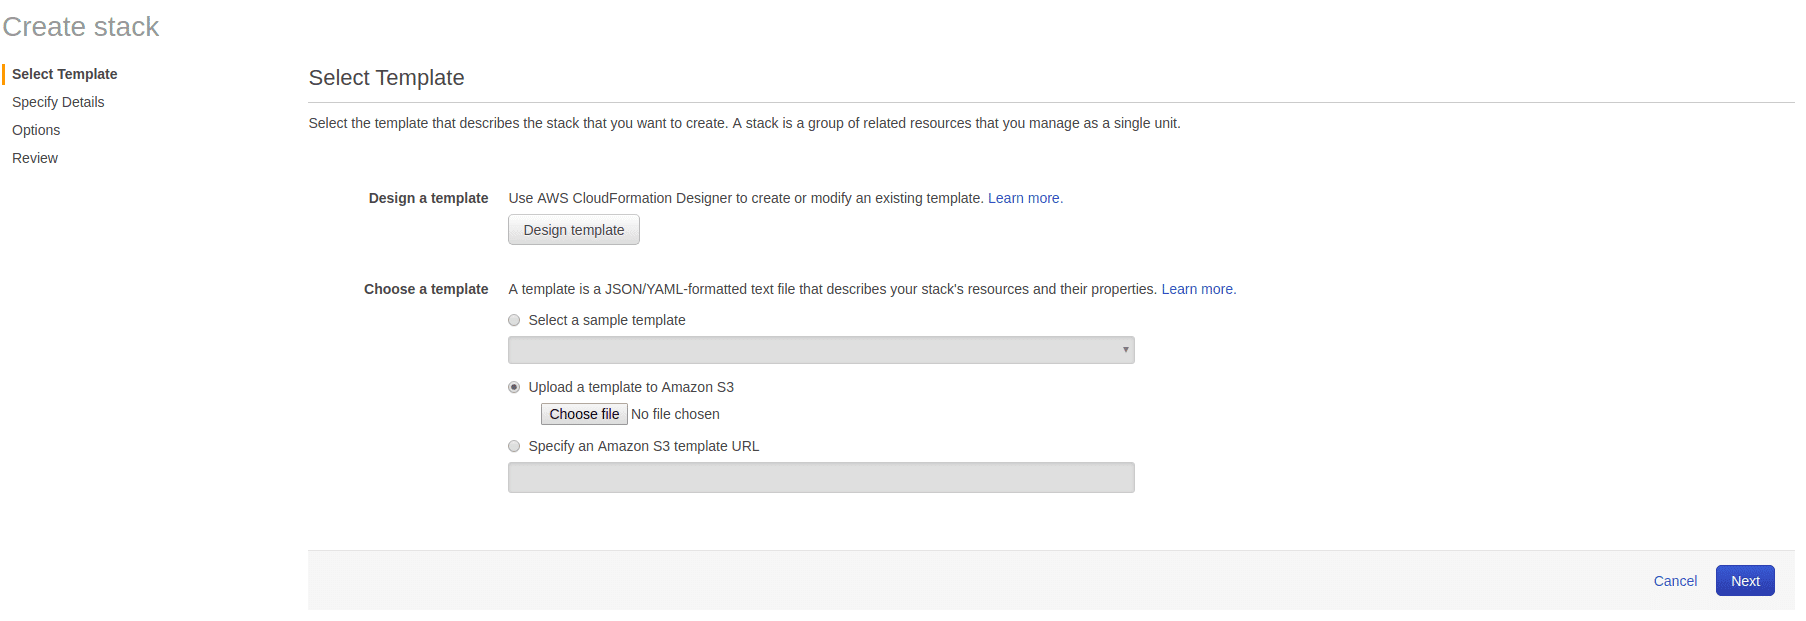
Here you need to fill the form for creating the template. You can choose to select an existing Amazon S3 or can mention a template URL. Once you fill all the fields, click on next. This will create the Athena stack for you using cloud formation template.
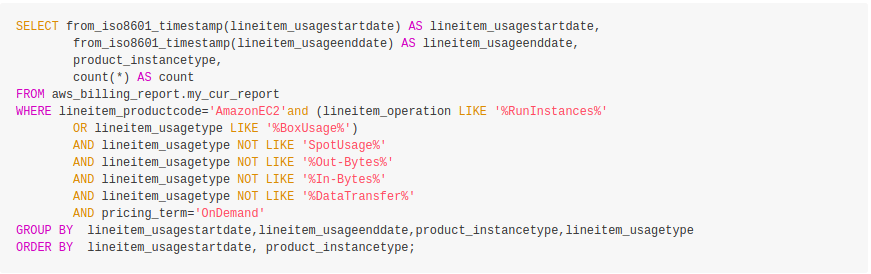
Following is the query command, to access the cost and usage statistics. Also, you can try running the following code on the Athena editor to view the results.
Setting up Quicksight
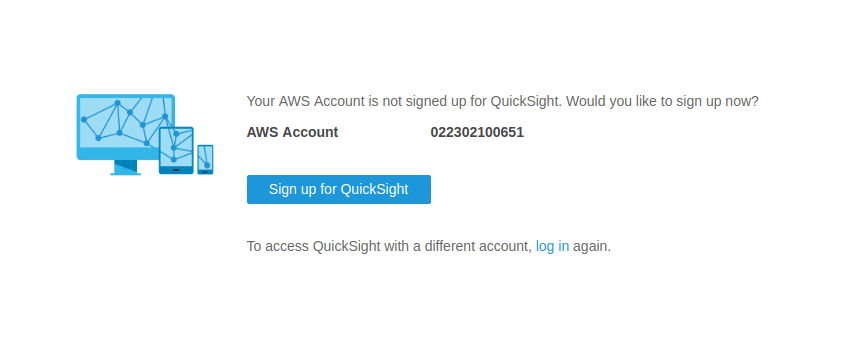
Now we have our Athena and S3 setup completely. We need to setup Quicksight now. Go to Quicksight section, and click on setup. There can be the case when you need to enable or signup for the Quicksight again. In case the below pop up appears, click on signup to create the QuickSight account
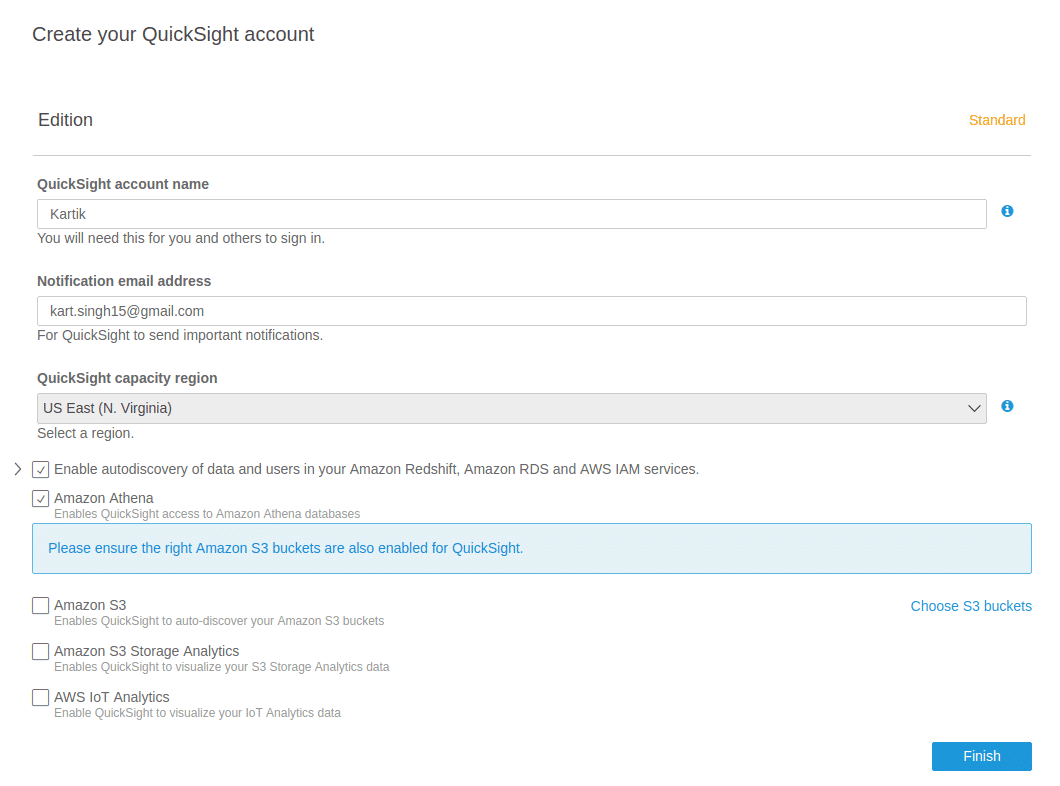
A sample form like below will pop up for you. Mention the account name, email address and the services you want to enable for Quicksight. Once you have filled all the entries, click on Finish to complete the setup
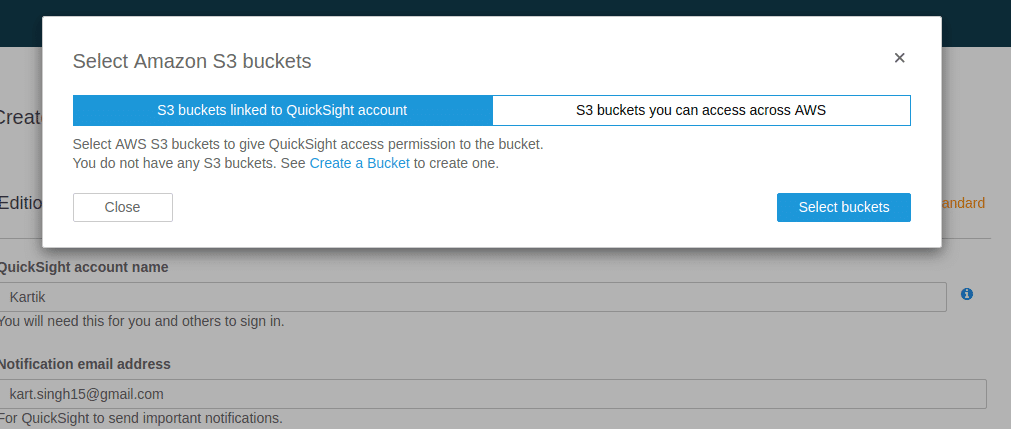
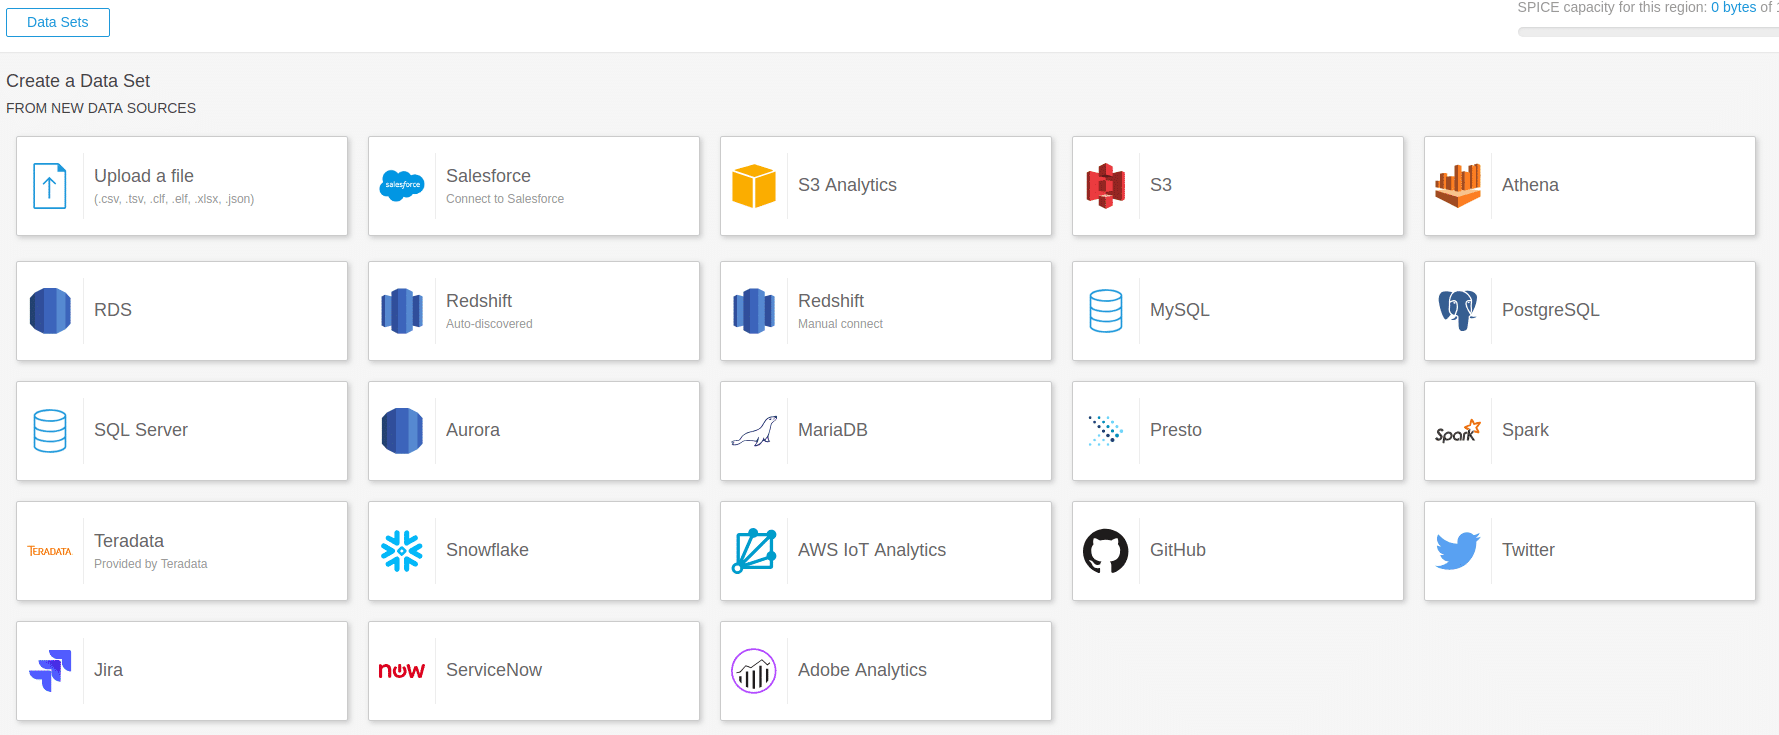
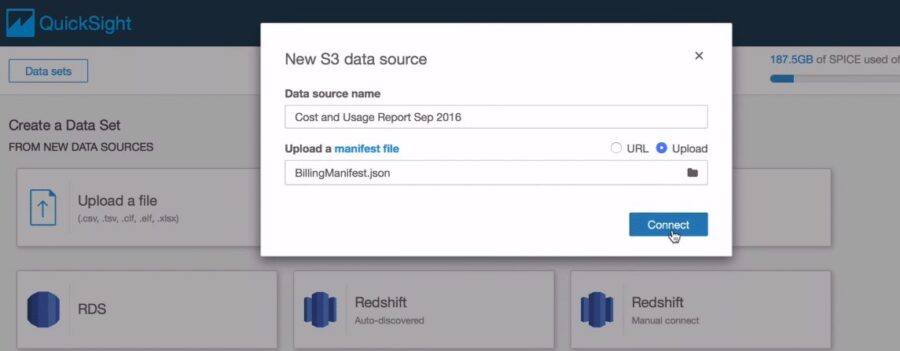
You can choose to connect your s3 account with Quicksight. In the following popup, a sample of already existing buckets will pop for you. You can select the pre-existing buckets and it will automatically get connected with your Quicksight. Here you can easily connect the bucket which holds your AWS cost and usage report. With bucket already connected, you can easily pull the cost and usage report into Quicksight and analyse it.
After setting up the Quicksight, a sample popup will come. You can click on Next to finish the setup.
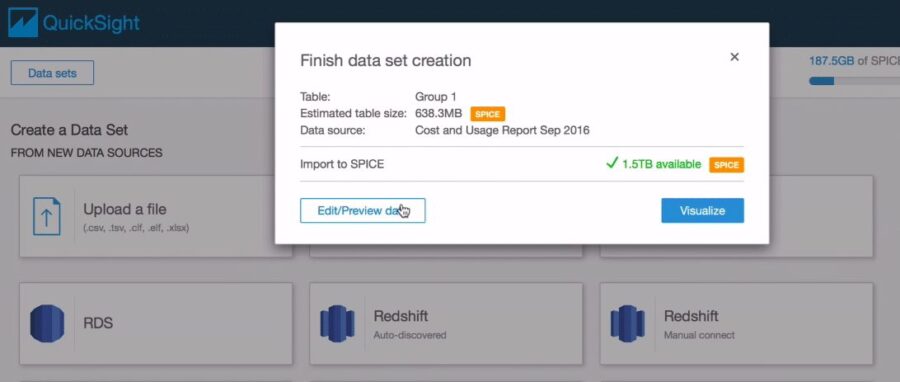
Now the basic setup of Quicksight is complete. All you want to do now is connect your S3 bucket with Quicksight using Athena. Click the Athena option and run the code to extract the usage report into the AWS S3 storage.
You can then select the column names present in the left sidebar panel to plot the charts in the right panel. Quick sight is a drag-and-drop visualisation tool. You can search for the columns and quick sight will show you the suggested visualisations. You can choose the visualisation and drop it onto the right canvas.
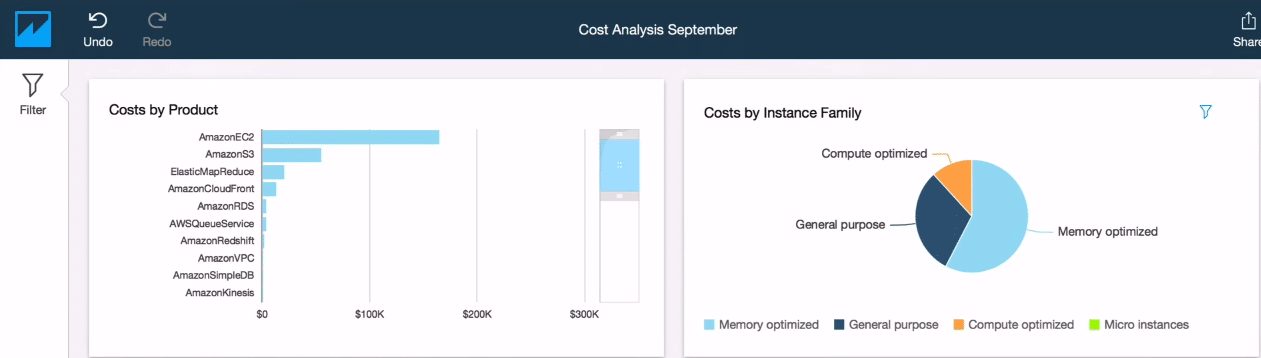
It will automatically plot the charts for you. As you can see, below image contains cost by product visualisation of the AWS services. It also depicts the costs distribution of different instances running on AWS.
Summary
Data-driven decision making is essential throughout an organization. It is no longer prohibitively expensive to ensure access to BI to employees at all levels. Amazon’s QuickSight lets you create and publish interactive dashboards that can be accessed from browsers or mobile devices. You can embed dashboards into your applications, providing your customers with powerful self-service analytics. It easily scales to tens of thousands of users without any software to install, servers to deploy, or infrastructure to manage.
QuickSight is an innovative and cloud-hosted BI platform that addresses the shortfalls of traditional BI systems. Furthermore, its low pay-per-session pricing is a great alternative to the competition. QuickSight can get data from various sources including relational databases, files, streaming, and NoSQL databases. QuickSight also comes with an in-memory caching layer that can cache and calculate aggregates on the fly. With QuickSight, data analysts are truly empowered and can build intuitive reports in minutes without any significant set up by IT.
If you want to read more about data science, you can read our blogs here