Let’s face it – cleaning data is a waste of time.
If only the data had been collected and entered carefully in the first place, you wouldn’t be faced with days of data cleaning to do. Worse still, your boss probably doesn’t understand why you can’t just do it in a few minutes. After all, you only need to click a few buttons in Excel, don’t you?
Yeah, right…
Well, we all hate data cleaning, but if we get organised and learn a few tricks there are ways to fast-track it and get it done in a fraction of the time.
In fact, there are just 5 steps to getting your data clean and analysis-ready quickly and painlessly.
Step 1: Plan, Plan, Plan – Then Plan Some More…
I’ve been involved in many studies at the data collection stage without being consulted in the planning of the study. In every single case, it turned out that the study had not been thought through properly, there were big problems with the study and we had to go back to the beginning to plan it all again. I guess they all thought that there’s no need to involve a data analyst until you actually have some data.
Oh, how wrong can they be…
You see, data analysts and statisticians start thinking about the end game right at the beginning, and that includes deciding which statistical tests will be used on the data, even before the data have been collected. They’ll consider which variables are important, which interactions should be interrogated and which statistical package will be used for the analysis.
Each statistical package has its own particular quirks, and if you know what they are you can arrange your data accordingly right from the beginning.
This is what I mean by planning. It’s not just about collecting your data. It’s about collecting your data to the necessary degree of precision, in the correct format, and making sure that it is fit-for-purpose and capable of answering your research questions.
Plan, Plan, Plan – Then Plan Some More
Ask yourself if you’re sure that the data you plan to collect will fit into the nice, neat boxes and categories you’ve designed. If you’re not absolutely sure, then do a pilot study first – go out and collect some data. The data you collect might surprise you, and it might change the nature of your study.
So then you go back to the drawing board and plan some more. Keep doing it until you KNOW how your study will progress.
A wise man once said that ‘a well formed question contains its own answer’. As far as I’m concerned, if you’ve planned your study well enough you’ll already know what the outcome is likely to be.
Well, maybe, but at least there will be few surprises…
Step 2: Data Collection
Making sure that your data is as clean as it can be even before you start data cleaning is the best and easiest way to hold on to your sanity.
Of course, if your data is inherited from someone else there may be little you can do about it, but if you’re collecting your own data, deciding on a few standards before you get started will save a lot of pain later.
It’s Data Collection Jim, But Not As We Know It
Photo Credit: JD Hancock via photopin cc
For example, if your dataset is small enough to fit on a single Excel worksheet, then enter it into a single worksheet. If you enter it across multiple worksheets and then need to sort your data you’re likely to make mistakes that can’t easily be corrected. Oops – you’ve just screwed up your dataset and need to start again.
Most statistics and analysis packages require that your data is arranged so that each column is a single variable (Height, Weight, Inside Leg Measurement, etc.) and each row corresponds to a single sample (patient, test-tube, customer, etc.), so get into the habit of formatting your data like this. Oh yes, and row 1 – and only row 1, not 2, 3 or 4 – is reserved for the name of your variable.
I also highly recommend creating a unique ID column in column A, numbered in consecutive integers. You’re going to need to sort your data by different columns and you’ll need a way to restore the original order, and this is the best and easiest way to do it.
Also, did you know that Excel has a built in Data Entry Form that you can use to enter your data quickly and easily? It’s probably Excel’s best kept secret – hardly anybody knows about it, but it’s a really useful feature.
Step 3: Data Cleaning
Data cleaning isn’t really about data cleaning. It’s about being organised. Anybody can clean data, but not everybody can clean data quickly and efficiently. Organising your Excel workbook before you get started with your data collection or data entry is a skill that is worth learning.
You should create a worksheet for your Raw Data, another for Cleaning In Progress, a third worksheet for Cleaned Data and one for Data For Analysis. Each of these worksheets will show your dataset in various stages of preparation, and – if done correctly – when you discover an error in later worksheets you will be able to follow the trail back to the point at which the error was introduced. I guarantee you’ll feel a flush of satisfaction when that happens!
Other sheets that you’ll need in your workbook include a Codes sheet, a Notes sheet, Spare Sheets 1, 2, 3, etc., where you’ll clean your data in independent columns. Well, you don’t expect to do your data cleaning in the same worksheet where your data is stored do you? Does the Find & Replace feature work only on the column you’ve selected or does it apply to the whole worksheet? Are you sure? Really REALLY sure?
And what about the Invisible Man? I really hate this guy. He lurks around in your dataset looking smug and self-satisfied. Well, at least, that what he would look like if you could see him! Trailing and leading spaces can wreak havoc on your analyses, so finding and removing them is a critical skill to have. Fortunately, Excel has a few formulae – including TRIM, CLEAN and SUBSTITUTE – that when used in combination can remove trailing and leading spaces and all non-printing characters from your entire dataset in as little as 60 seconds. Yup, you read that right – 60 seconds, irrespective of the size of your dataset! Learning this little trick can save weeks of data cleaning all on its own.
Data Cleaning Just Makes Me Want To Sing…
Excel also has a plethora of other data cleaning tools for your delectation that will help streamline the whole process, such as Remove Duplicates, Find & Replace, tools for standardising the case of your text data, such as LOWER, UPPER and PROPER.
Oh, and did anybody say Spell Checker?
Step 4: Coding & Understanding Your Data
Some data is collected and some is not. Height is collected, and so is Weight, but Body Mass Index is calculated (from Height and Weight). Sometimes, data that is collected needs to be rounded, and sometimes it should be placed into categories. For example, Weight may be measured in kilograms or in pounds and rounded to the nearest 1, 2, or 3 decimal places (using ROUND, ROUNDUP or ROUNDDOWN). Alternatively it could be categorised as Underweight, Normal, Overweight or Obese. It all depends on what you plan to do with your data and how you wish to analyse it, but you will often need to perform calculations on it.
It’s quite a good idea to create a new worksheet, titled Calculated Data, and this is where you will create composite variables (like Body Mass Index), convert numerical variables to categories, and round your data.
Here’s Where Your Dataset Will End Up If You Don’t Do Things Properly
Photo Credit: NASA Goddard Photo and Video via Flickr cc
You may also have stored your categorical variables as text, such as Small, Medium, Large. Will your favourite stats program allow the use of text variables, or will you have to convert them to integers? Here’s where you’ll make these conversions, and learning how to use VLOOKUP and HLOOKUP will help make this process as painless as possible.
Oh yes, and when you’ve coded your variables, make sure you make a note in your Codes sheet.
Step 5: Data Integrity
Real life follows rules, and so must your data. There have been many times when I’ve discovered patients in a dataset that are over 300 years old or who have an age less than zero. Calculating descriptive statistics can help you find values in your data that don’t break any Excel rules, but are incorrect nonetheless.
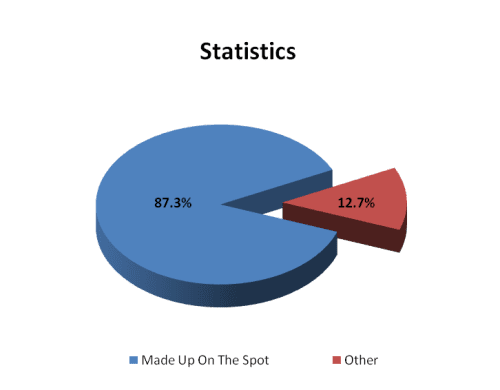
 It’s True Folks. It Must Be – I Read It On The Internet…
For numerical entries, learn how to use the formulae COUNT, MIN, MAX, and AVERAGE. For text entries, using COUNTIF can tell you how many entries of Small, Medium or Large you have in your variable. For empty cells, COUNTBLANK is a very useful formula to use.
If you really want to impress your boss, you can use Excel’s QUARTILE function to identify statistical outliers in your numerical variables. Deciding what to do with these can make or break your analysis, so it pays to find them at an early stage.
Summary
Well, I hope you got something useful out of this blog post.
We’ve learnt that planning your study diligently is really important – probably the most important thing about your data.
Data collection and data cleaning are about being organised and having an Excel workbook and a work system that allows you to see all stages of the process, and crucially is about being able to work backwards to identify where and how errors were introduced.
Finally, you should understand your data and make sure that it is fit-for-purpose and capable of answering your hypotheses. Of course, if you’ve planned your study carefully right back at the beginning, then all of this will just drop into place.
Don’t you just love it when a plan comes together…
The issues highlighted in this blog post are discussed in more detail – with a free Excel Data Cleaning Cheatsheet to download – here.
About the Author
 Lee Baker is an award-winning software creator with a passion for turning data into a story.
A proud Yorkshireman, he now lives by the sparkling shores of the East Coast of Scotland. Physicist, statistician and programmer, child of the flower-power psychedelic ‘60s, it’s amazing he turned out so normal!
Turning his back on a promising academic career to do something more satisfying, as the CEO and co-founder of Chi-Squared Innovations he now works double the hours for half the pay and 10 times the stress – but 100 times the fun!
He also wanted to be rich, famous and good looking. Ah well…
PS – Don’t forget to connect with me in Twitter: @eelrekab
Other Articles by the same Author
- Free Alternatives to Excel for Data Cleaning
- 5 Free Data Science eBooks For Your Summer Reading List


