
ECommerce fraud is growing quickly, creating new challenges in terms of prevention and detection. As merchants gather more and more information about customers and their behaviors, the key element in the fight against fraud is now to draw on the connections within the data collected to uncover fraudulent behaviors. In this post we explain why and how graph technologies are crucial in the detection of eCommerce fraud.
eCommerce: a fertile ground for fraud
In the past years the eCommerce market has continually expanded, reaching up to 1.9$ trillions in terms of transaction value in 2016. Ecommerce sales are still growing rapidly and are forecast to reach $4 trillion by the end of 2020, notably with retailers pushing into new international markets.
In the meantime, eCommerce fraud has become a multi-billion dollar industry. A study conducted by Juniper estimated the average cost for merchants between 0.3% and 3% of revenues, depending on the vertical and the region. Below are some examples of today’s most common fraud schemes.

The adoption of new technologies, payment methods and data processing systems has benefited to fraudsters, opening new doors to bypass existing security measures and cover their tracks. Professional fraudsters are organizing themselves into networks. They exchange knowledge and technology across the globe and devise new schemes to stay one step ahead of the latest anti-fraud technology.
A layered approach to fight fraud raising technical challenges
Faced with increasing flows of money and evolving fraud schemes, but also with new technology disrupting traditional security measures, anti-fraud teams in eCommerce companies need to adapt.
The traditional “silver bullet” approach of relying on one or two anti-fraud strategies is no longer enough. Best in class organizations combine multiple complementary approaches to maximize the accuracy of fraud detection and avoid false positives that negatively impact reputations. With numerous fraud prevention solutions available – from device authentication to proxy piercing or address verification service – the layered approach shows better results in detecting fraud attempts.
In their Market Guide for Online Fraud Detection, Gartner’s fraud analysts outlined five critical layers to tackle today’s threats: end-point, navigation, channel and cross-channel centric layers and an additional entity link analysis layer.

Gartner’s conceptual model of a layered approach for fraud detection
In order to carry out connected analysis, eCommerce vendors need technologies able to work with cross-channel data and perform relationship analysis at scale. However, most of today’s anti-fraud solutions (whether it’s homemade or provided by a vendor) still relies on relational databases, designed to store data in a tabular format. Detecting connections between entities typically requires to join tables using foreign keys which becomes computationally intractable after a few hops.
As a result, eCommerce anti-fraud teams are still limited by product and channel silos that provide little or no cross-channel view of a subject’s behavior. Existing structures are too rigid to allow the easy adoption of new rules or data, making it hard to keep pace with new products and schemes.
Graph technology: the answer for connected analysis
To be able to perform connected analysis and reinforce their fraud detection system, many eCommerce merchants are choosing to leverage graph technology. This approach relies on a graph data model where all the data is stored as a graph. The entities are stored as nodes, connected to each other by edges. Popular graph databases vendors include DataStax, Neo4j, Titan.
Graph technology allows to gather and connect customer, transaction, behavior or third party data into a unique data model. This is essential to discover fraud attempts that are often hidden beyond layers of deceit. For instance, instead of examining credit card transactions over a lapse of time, analysts can query the graph data to investigate how it’s connected to other entities such as IP addresses, customers, devices.

Visualization in Linkurious of cross-channel data stored as a graph in Neo4j
The graph approach makes it easier and faster to query connections within the data. Anti-fraud teams can run queries traversing datasets of millions of records to unveil suspicious connections. This is critical to detect networks and suspicious patterns in real-time. But in order to speed up the analysis process, and therefore the response time, eCommerce merchants need intuitive accesses to this graph data.
Detecting eCommerce fraudulent activity
To illustrate what fraud detection analysis with Linkurious Enterprise looks like, we created a small dataset with dummy eCommerce data and loaded it into a graph database. In the following sections, we explain how anti-fraud teams can leverage Linkurious Enterprise to detect and investigate fraud attempts.
Setting up alerts to monitor fraud attempts
As new fraud schemes emerge, the ability to create detection rules on the fly is critical. Graph traversal languages, such as Cypher or Gremlin are simple yet complete enough to let analysts imagine new queries that will flag fraudulent behaviors. Linkurious Enterprise offers an alert dashboard to generate and monitor different alerts and assess the flagged cases.
For instance, we want to set up an alert query that returns any transactions that have a connection with at-risk-countries. The list of these countries is integrated in the graph model and appears as a property on our country nodes. The data is processed in near-real time and you get an immediate response of whether or not there is such patterns in your data.

Setting up alerts in Linkurious using Cypher query language
The above alert will flag transactions where the IP or delivery addresses is located in one of the countries on my “at-risk-countries” list. For every case reported, a team can visually investigate the data.
Visually investigating graph data
Whether it’s to investigate specific alert cases or learn more about a particular entity, analysts can easily search and visualize their data in real time in the Linkurious Enterprise interface. For instance, we can generate a visualization compiling a subset of transactions and their related connections with a simple query. Below is the visualization of our subset of transactions (red nodes), the associated credit cards (blue nodes) and customer accounts (green nodes). We see that nodes are connected together, depicting the ownership relationships between credit cards and customers.

Example of visualization of graph data nodes (customer, credit card and transactions) and their connections
By using different graph layouts, we can easily reveal structural patterns in the data to identify differences in a glimpse. In the example below, we switched from a force-directed layout to a hierarchical layout in order to better understand the different cases we have.
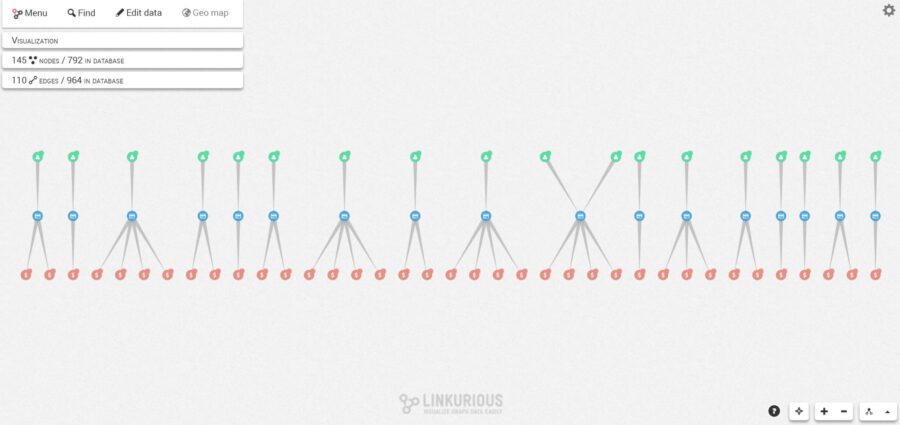
Visualization with a hierarchical layout a of subset of transactions and their related nodes
We immediately notice a suspicious pattern in the graph. Customers (green nodes) are typically connected to a single credit card (blue node) which is connected to one or several transactions (red nodes). But there’s one case where two green nodes (two customers), are connected to the same credit card which is suspicious.
It is easy to drill down on a suspicious case with the Linkurious Enterprise interface. Analysts simply expand the nodes around suspicious patterns to reveal other connections within the data and assess the situation. In our example, we expanded the nodes around our two customers and the transactions to unveil a sub-graph with additional information (customer IP addresses, contact information, addresses, goods bought and shipping addresses).

Investigation of the neighboring nodes of our suspicious customers
With this visualization, we understand that actually three users are involved. Two of them, from different countries, ordered goods and shipped them to a third client, which could indicate a reshipping fraud.
Graph technology offers an additional layer of protection for eCommerce companies. It enhances discrete analysis methods by providing connected analysis capabilities over a single source of truth of customer data. Anti-fraud teams have an intuitive tool to detect and investigate fraud attempts and fraud rings that would otherwise stay undetected.