

Note: I got feedback that my Data Product Blueprint process in Figure 7 was waterfall, not agile. Totally agree and that’s my bad. I’ve updated the image and will release a future blog to address the questions that I got about that process. Thanks for your feedback!
A Blueprint is a detailed design plan of something to be built.
I have written several articles about Data Products and the role that they are playing in helping organizations monetize their customer, product, service, and operational analytic insights (individualized predicted behavioral and performance propensities).
In my first blog, “Data Apps and the Natural Maturation of AI”, I stated that Data Products were the natural maturation of AI – from a technology capability to a business discipline for delivering more accurate, more predictive, more relevant, more timely business outcomes.
Data Products are a category of domain-infused, AI-powered products designed to help non-technical users manage data-intensive operations to achieve specific business outcomes.
In my next blog “The Economics of Data Products”, I discussed Data Products as the vehicle for helping organizations drive “Insights Monetization” through the packaging of customer, product, and operational insights to optimize customers’ and partners’ operational decisions (Figure 1).
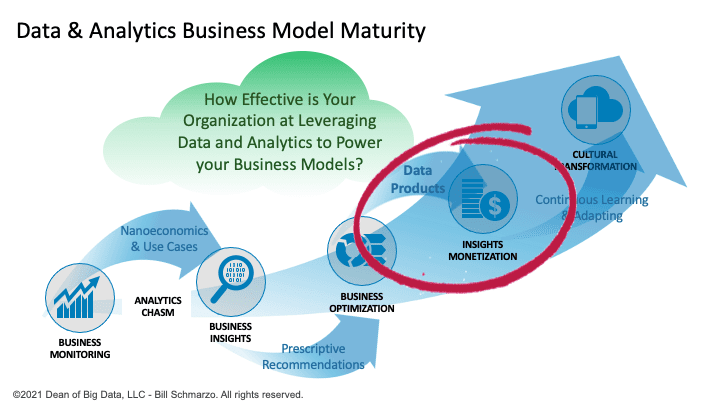
Figure 1: Insights Monetization through Data Products
And in my latest Data Products blog, I introduced the “Data Product Development Canvas” as a design tool to guide organizations in the creation of these Data Products.
This blog pulls together several key design templates to create a Data Product Blueprint to help organizations build their data products business; a business that can yield net new revenue streams while accentuating the value of the organization’s base products and services.
Note: I will use the Order-to-Cash (OTC) cycle to explain the Data Product Blueprint concepts.
Blueprint Design Canvas #1: Customer Journey Map
The Customer Journey Map ensures that we understand where and how customers and key constituents create or realize value by walking in their shoes as they try to achieve or accomplish a specific outcome (buy a car, select a college, fix a broken manufacturing press).
For example, the OTC cycle is an enterprise-wide business process (journey) for receiving and fulfilling customers’ requests that result in the delivery of specific goods or services outcomes. The OTC journey crosses multiple business operations including Order Management, Credit Management, Order Fulfillment, Order Shipping, Customer Invoicing, Accounts Receivable, and Payments Collections (Figure 2).
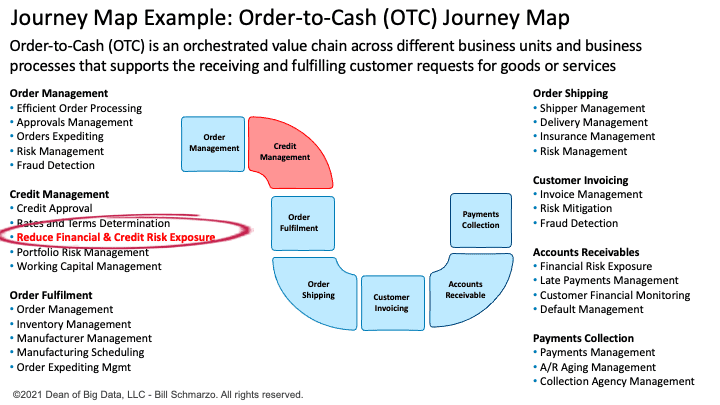
Figure 2: Order-to-Cash (OTC) Journey Map
We can use the OTC journey map to identify the use cases for each business domain. For example, the Credit Management business domain would have the following use cases:
- Credit Approval
- Rates and Terms Determination
- Reduce Financial and Credit Risk Exposure
- Portfolio Risk Management
- Working Capital Management
For this exercise, we are going to drill down into the “Reduce Financial and Credit Risk Exposure” use case.
Note: Business Model Canvas developed by Strategyzer is a popular design canvas for helping organizations describe and design their business model. I have assumed for this exercise that organizations have already established their desired business model and now are looking to become more effective at leveraging data and analytics to power that business model.
Blueprint Design Canvas #2: Use Case Canvas
Next, we want to capture important details for each of the identified use cases. We want to collaborate with key subject matter experts to flesh out for each use case the important execution details including Objectives and Ideal Outcomes, Sources of Business Value, Execution Impediments & Risks, Implementation Considerations, and Impact on the Organization’s Financial and Operational Goals (Figure 3).
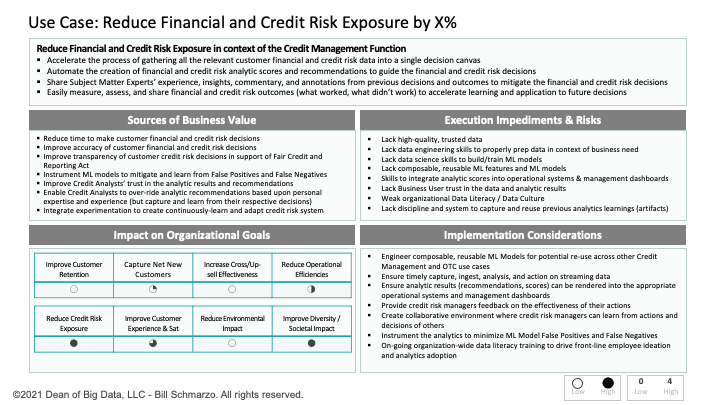
Figure 3: Reduce Credit Risk Exposure Use Case Canvas
Notice the bottom of the Use Case Canvas renders an assessment of the Overall Financial Impact and Ease of Implementation on a scale of 0 to 4. These assessments are used to jump-start the Prioritization Matrix process that drives organizational alignment and consensus on the prioritized use case roadmap.
Blueprint Design Canvas #3: Hypothesis Development Canvas
The Hypothesis Development Canvas facilitates the business stakeholder-data science collaboration to ensure that we thoroughly understand the business problem we are trying to address, the KPIs against which we will measure success, the key decisions that the need to be optimized, and the potential impediments and potential risks (including the costs of False Positives and False Negatives) associated with addressing the business problem (Figure 4).
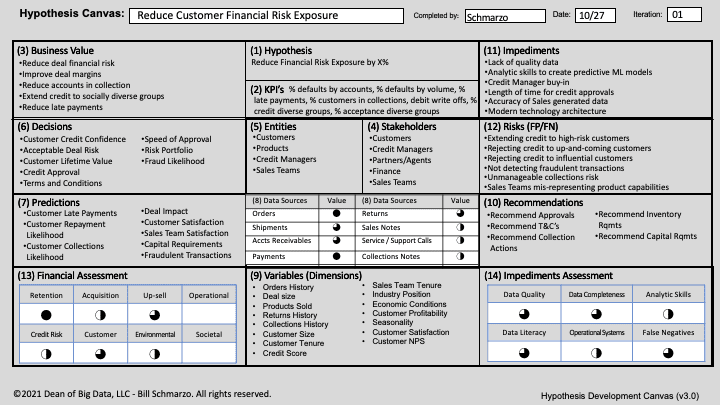
Figure 4: Reduce Risk Exposure Hypothesis Development Canvas
The Hypothesis Development Canvas is an output of the “Thinking Like a Data Scientist” methodology that brings together business subject matter experts with data team members to define the use case’s data and analytic requirements including use case desired outcomes, key stakeholders, analytic entities around which we will build analytic scores, the decisions, predictions, and recommendations to address the use case, the data and analytic requirements (feature engineering), and the potential people (cultural), process, and technology impediments.
Blueprint Design Canvas #4: Data Product Development Canvas
The final step in the Data Product Blueprint process is the creation of a Data Product Development Canvas to guide the development, operationalization, and ongoing management of the Data Product.
The Data Product Development Canvas is an easy-to-comprehend tool for facilitating business and data team collaboration in triaging the targeted business problem and identifying the data and analytic components and requirements for the development of a Minimum Viable Data Product (MVDP) to achieve or deliver a specific business or operational outcome.
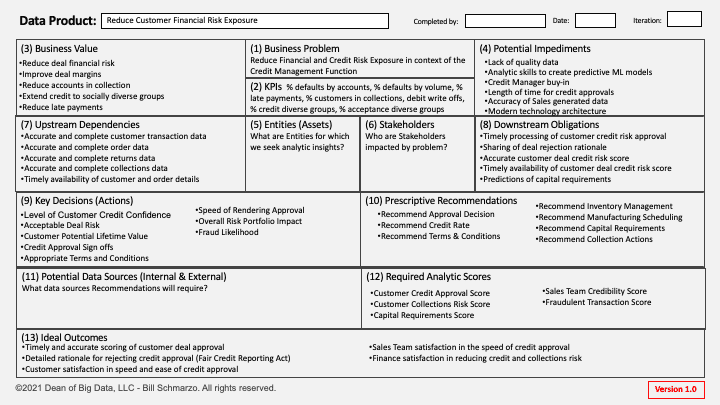
Figure 5: Data Product Development Canvas
Some of the key operational requirements captured in the Data Product Development Canvas include upstream dependencies (that is, what data and/or analytics need to be captured and provided by upstream processes or use cases to support our use case) and downstream obligations (that is, what data and/or analytics does our use case need to capture and provide to downstream processes or use cases).
Notice that many of the success criteria and potential impediments are repeated across the Use Case, Hypothesis Development, and Data Product Development canvases. That is to ensure that we don’t let the scope of the Data Product slip as we move through the Blueprint process.
Summary: Data Products Business Blueprint Summary
The opportunities for Data Products are almost endless – opportunities to expand an organization’s “Data Innovation Index” to create net new revenue streams while accentuating the value of the organization’s base products and services (e.g., automobiles, CT scanners, compressors, motors, wind turbines, televisions, refrigerators, washing machines). See Figure 6.
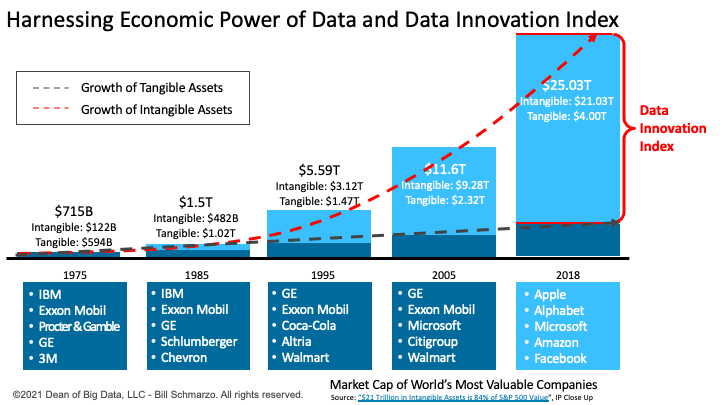
Figure 6: Data Innovation Index
All organizations need is a blueprint – a detailed design plan of something to be built – to help them master the Data Innovation Index through data products. Hopefully, this blog is the start of that mastery (Figure 7).
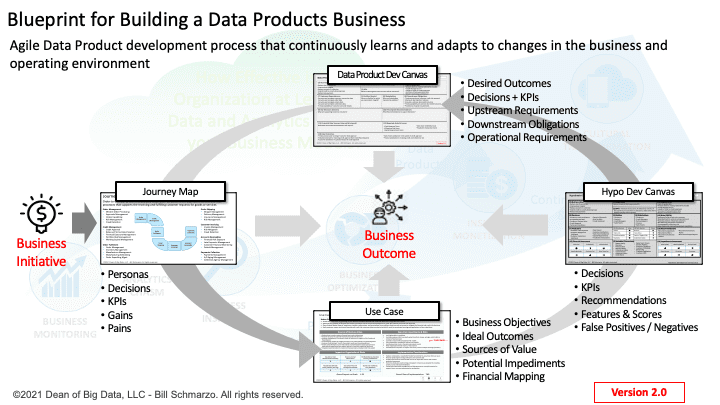
Figure 7: Data Products Business Model Blueprint